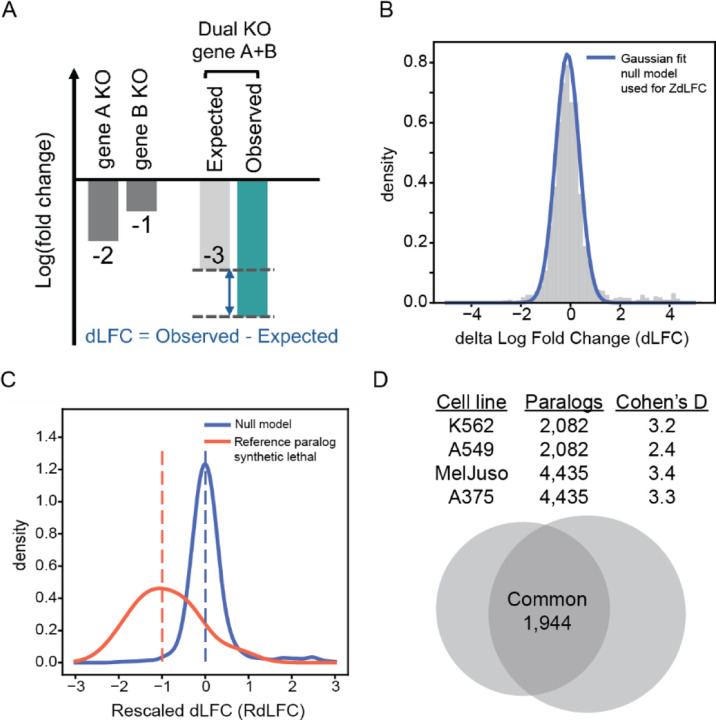
Figure 1.
(A) Measuring synthetic lethality between paralog pairs. Single gene knockout (KO) fitness is determined by calculating the mean log fold change (LFC) of gRNAs targeting the specific gene. The expected dual gene KO fitness is the sum of the single gene KO LFCs for gene A and gene B. The Delta log fold change (dLFC) represents the difference between the observed and expected dual KO LFC. (B) The dLFC histogram of an Inzolia screen is shown with a normal distribution fit after removing outliers (Methods). The blue curve represents the fit of the null model, which is used to calculate the ZdLFC scores. (C) The dLFC distribution of an Inzolia screen after rescaling (Methods). The red and blue curves indicate kernel density plots of the 13 reference paralog synthetic lethal (positive control) and the null model (negative control), respectively. The dotted lines indicate that the median of positive controls is rescaled to −1, while the negative controls are set to 0. (D) Table displaying the four screens conducted with the Inzolia library: the “prototype” library in K562 and A549 cell lines, and the final Inzolia library in MelJuso and A375 cell lines. The table includes the number of paralogs in each screen and the Cohen’s D quality score, which measures the LFC differences between essential and nonessential controls relative to variability (Methods). The Venn diagram illustrates the number of common paralog pairs between the “prototype” and the final Inzolia library.

