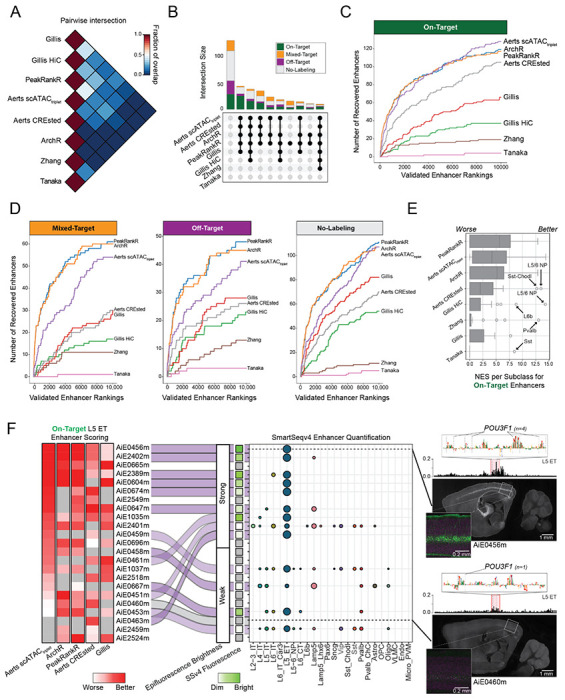
Figure 2. Comparison of team enhancer rankings.

(A) Average proportion of ranked enhancers that overlap between pairs of team submissions for all cell types.
(B) Upset plot showing the number of validated enhancers that were identified by sets of submissions.
(C,D) Rates of identification of (C) On-Target and (D) Mixed-Target, Off-Target and No-Labeling enhancers.
(E) Distributions of normalized enrichment scores (NES) for cell type specific rankings.
(F) Heatmap ordered by Aerts scATACtriplet scoring of L5 ET enhancers and summary of validation results. Examples of a strong (AiE0456m) and weak (AiE0460m) enhancer with Pou3f1 motifs identified by the CREsted model in the highlighted region. AiE0456m was also validated with SSv4.
