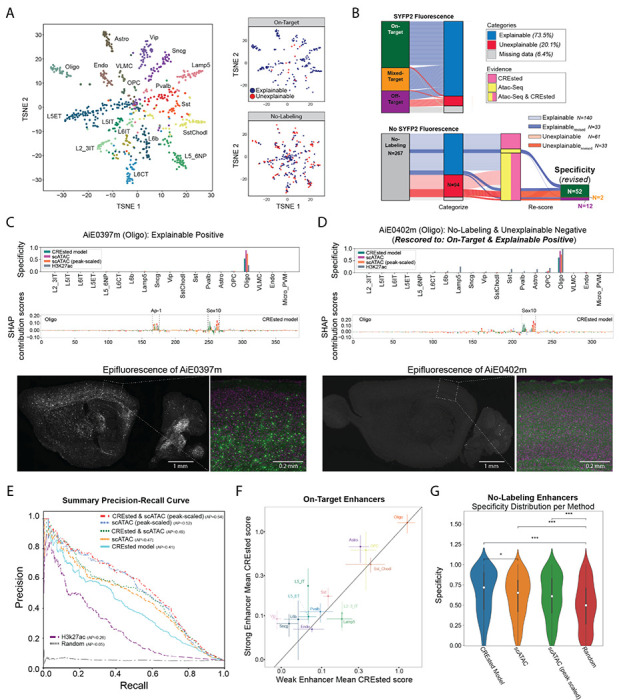
Figure 4. Refinement of models and enhancer screening results.

(A) tSNE plots of enhancers based ATAC-seq specificity and labeled by the targeted cell type. On-Target and No-Labeling enhancers had explainable or unexplainable cell type labeling patterns based on ATAC-seq and DNA sequence (CREsted) model predictions.
(B) River plots of enhancer activity, predictions and rescoring of experimental validation data.
(C-D) Model scores, predicted TF motifs and SYFP fluorescence for two Oligo enhancers with (C) strong On-Target and (D) No-Labeling rescored to weak On-Target activity.
(E) Performance of enhancer ranking methods using the rescored enhancer activities. AP, average precision.
(F) CREsted model scores for strong and weak On-Target enhancers grouped by cell type. Mean +/− SEM.
(G) Comparison of models at identifying No-Labeling enhancers. * P < 0.05, *** P < 0.001, Wilcoxon rank-sum test, Bonferroni-corrected P-values.
