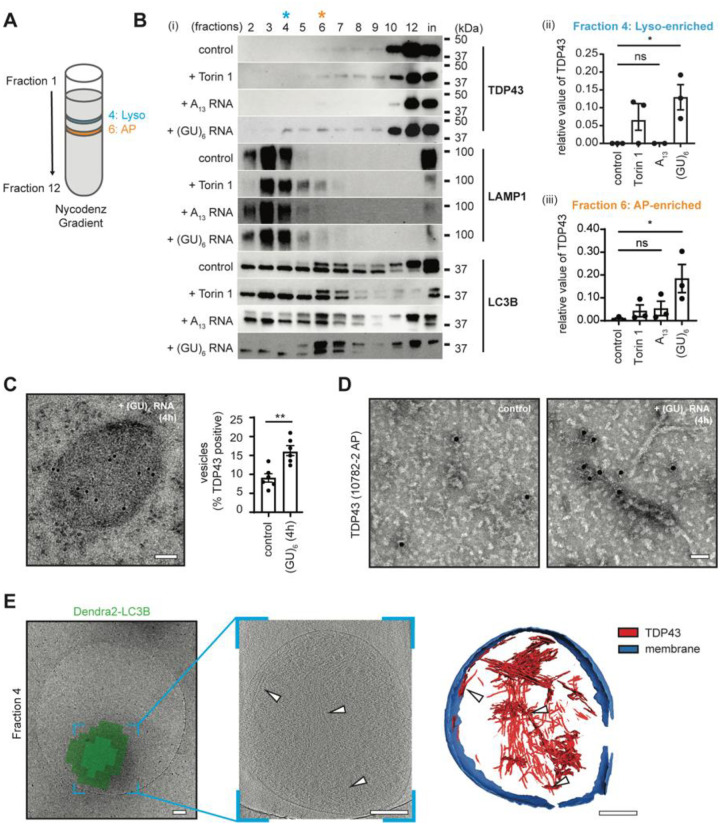
Fig. 2. GU-rich oligonucleotides induce the formation of TDP43 fibrils in autophagosomes and lysosomes.
(A) Schematic of Nycodenz density gradient fractionation protocol to isolate autophagosomes (AP) and lysosomes (Lyso) from HEK293T cells. (B) (i) Representative immunoblots of fractions 2–12 and membrane fraction input (in) isolated from oligonucleotide-treated Dendra2-LC3B HEK293T cells, detected with anti-TDP43, -LAMP1, and -LC3B antibodies. n=3. Quantification of TDP43 in fractions 4 (ii) and 6 (iii) (mean ± SEM, ANOVA, Tukey’s test, *p < 0.05). (C) Anti-TDP43 immunogold labeling on an ultrathin section of (GU)6 treated Dendra2-LC3B HEK293T cells (left). n=6. Quantification of TDP43 positive vesicles in oligonucleotide-treated Dendra2-LC3B HEK293T cells (right). (Welch’s t-test, **p < 0.005). Scale bar, 100nm. (D) Representative negative stain EM images of immunogold labeled detergent insoluble TDP43 fibrils from Dendra2-LC3B HEK293T cells using anti-TDP43 antibodies. Scale bar, 50nm. (E) Correlative cryo-ET of lysosome enriched fraction from (GU)6-treated Dendra2-LC3B HEK293T cells. Cryo-EM micrograph of lysosome overlaid with the Dendra2-LC3B cryo-fluorescence signal (left). Slice through the tomogram of the lysosome shown in the left panel (middle). White arrowheads highlight TDP43 fibrils. TDP43 fibrils and lysosome membranes in left/middle panels are segmented (right). Color scheme: red - TDP43; blue - lysosome membrane. Scale bars, 200nm.

