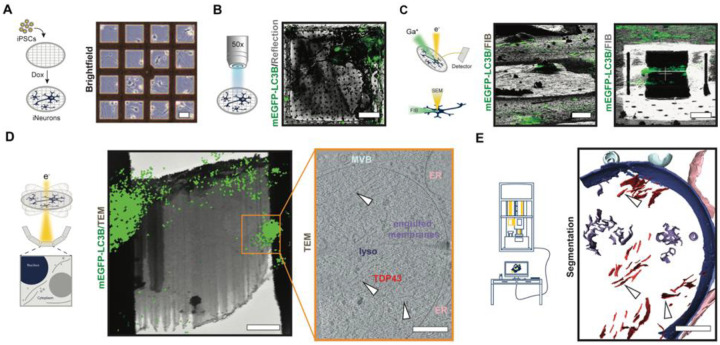
Fig. 3. Cryo-correlative workflow to study aggregates and probe proteinopathies in situ.
Representative images appear below each step of the workflow, with a schematic on the left. (A) Micropatterning and vitrification: doxycycline-inducible mEGFP-LC3B iPSCs are differentiated to iNeurons on micropatterned EM grids. Scale bar, 40μm. (B) Cryo-confocal microscopy: Cryo-confocal z-stacks with mEGFP fluorescence (green) and reflected light (grey) are collected of mEGFP-LC3B iNeurons (green) on grid squares for precise correlative cryo-FIB/SEM milling. Scale bar, 20μm. (C) Correlative cryo-focused ion beam milling (cryo-FIB): Cryo-confocal maximum intensity projection (MIP) of mEGFP-LC3B (green) overlaid on cryo-FIB image (grey) of mEGFP-LC3B iNeuron before milling (top). 3D-correlation toolbox (3DCT) was used to correlate the cryo-confocal and cryo-FIB data. Scale bar, 20μm. Bottom: Final lamella from cryo-FIB (grey) with MIP of mEGFP-LC3B (green) correlated fluorescence. Scale bar, 5μm. (D) In situ cryo-CLEM: Correlation of MIP of mEGFP-LC3B (green) and 6500x cryo-EM montage of cryo-lamella guides tilt-series positioning. Tilt-series were collected at the region of cryo-lamella highlighted with an orange box. Scale bar, 2μm. Slice through a tomogram of lysosome with TDP43 fibrils (bottom). White arrowheads indicate individual TDP43 fibrils. Scale bar, 200 nm. (E) Analysis: 3D segmentation corresponding to the volume represented in panel (D). Scale bar, 200 nm.

