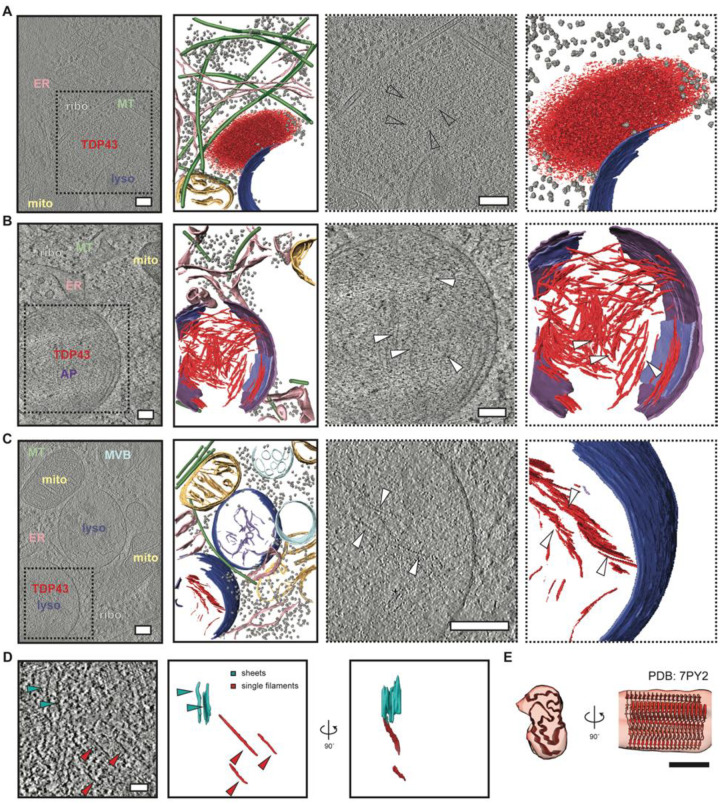
Fig. 4. In situ structural analysis of mislocalized TDP43 in (GU)6-treated human iNeurons.
Slice through tomograms and corresponding segmentation of the volumes (images with solid black outlines on the left) highlighting TDP43 inclusion architecture in DIV10 iNeurons treated with (GU)6 RNA for 24h, within an amorphous organelle excluded zone (A), within autophagosomes (B), or lysosomes (C), respectively. Cellular features are labeled and colored as: ribosome (grey) TDP43 (red), endoplasmic reticulum (ER, pink), mitochondria (mito, yellow), microtubules (MT, green), lysosome (lyso, blue), autophagosome (AP, purple), degraded membranes (lilac), and endosome/multivesicular bodies (MVB, sky blue). Scale bars, 200nm. TDP43 shows amorphous condensate-like morphology in the cytosol (A) but fibril-like morphology in autophagosomes (B) and lysosomes (C). The two right panels in (A-C, dotted black outline) are enlarged views of the slices through tomogram and segmentation on the left, highlighting TDP43 specifically. White arrowheads indicate individual TDP43 fibrils. Scale bars, 200nm. (D) Slice through a tomogram of the autophagosome with TDP43 fibrils (left panel). TDP43 forms sheets (cyan arrowheads) and individual filaments (red arrowheads). 3D segmentation of TDP43 sheets (cyan) and single filaments (red) en face and rotated 90° around the y-axis (right panel). Scale bar, 50nm. (E) Fit of TDP43 Type B variant 1 (PDB: 7PY2) atomic model to the subtomogram averaged map of TDP43 fibrils in iNeurons. Scale bar, 5 nm.

