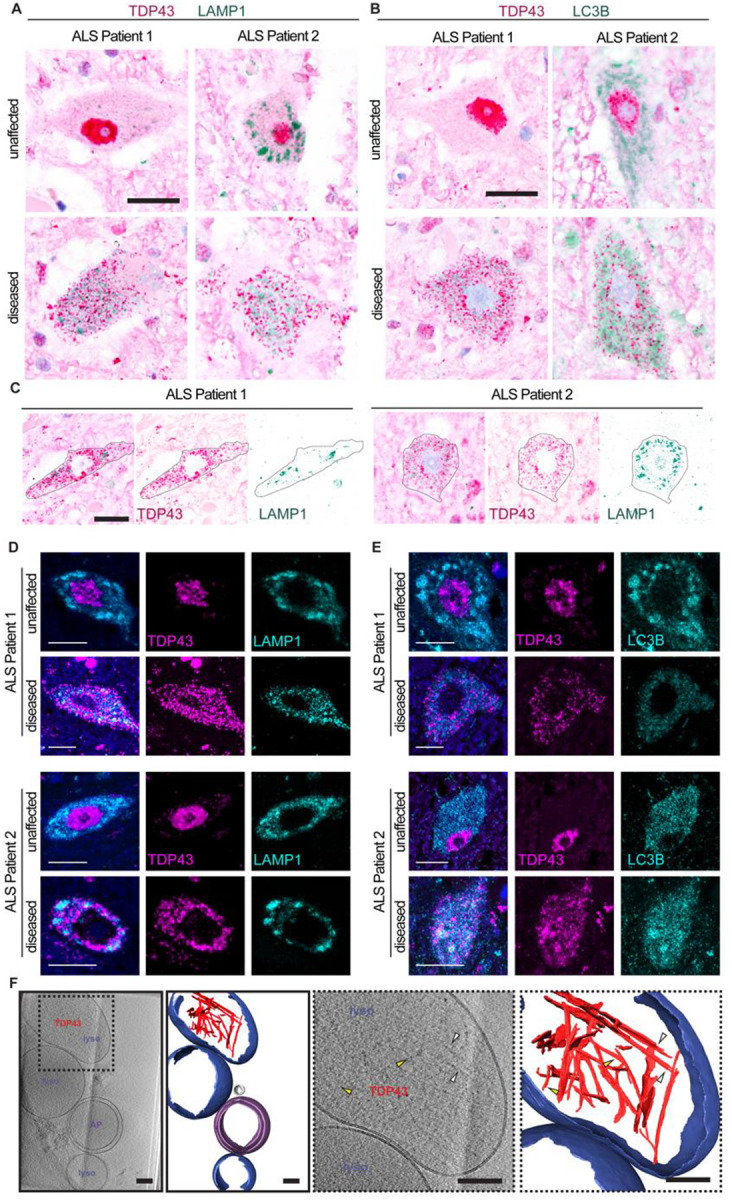
Fig. 5. TDP43 mislocalizes to lysosomes and autophagosomes in patient tissue.

(A-B) Immunohistochemistry for TDP43 (magenta) and (A) LAMP1 or (B) LC3B (green) in spinal cord of two patients with sporadic ALS show unaffected (top row) and diseased (bottom row) neurons. (C) Diseased neurons (outlined in black) in deconvolved immunohistochemistry images for TDP43 (magenta) and LAMP1 (green) in the spinal cord of two patients with sporadic ALS show colocalization of TDP43 and LAMP1. Scale bars, 20μm. (D-E) Immunofluorescence for TDP43 (magenta) and (D) LAMP1 or (E) LC3B (cyan) in the spinal cord of two patients with sporadic ALS show unaffected (top row) and diseased (bottom row) neurons. Diseased neurons show colocalization of LAMP1 or LC3B (cyan) with mislocalized, cytosolic TDP43 (magenta). Scale bars, 10μm. (F) Slice through tomogram and corresponding segmentation of the volume (images with solid black outlines on the left) highlighting TDP43 (red) within lysosomes (blue) isolated from ALS/FTLD patient postmortem brain tissue. Cellular features are labeled and colored as lysosome (lyso, blue), autophagosome (AP, purple), and vesicle (grey). The two right panels (dotted black outline) are enlarged views of the slices through tomogram and segmentation on the left, highlighting TDP43 specifically. Yellow arrowheads highlight thinner filaments and white arrowheads highlight thicker filaments. Scale bars, 100nm.
