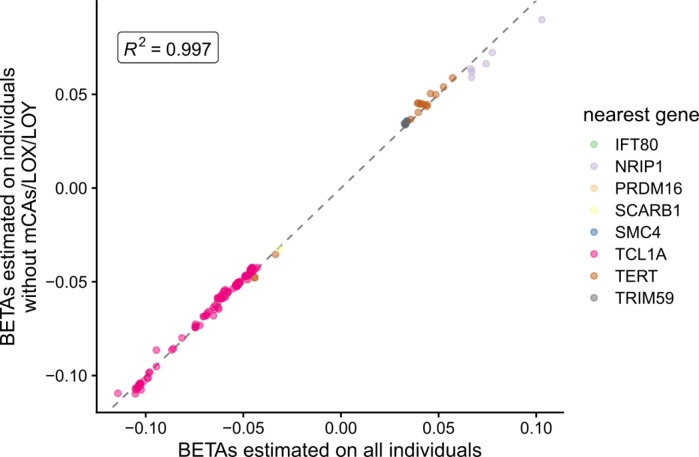
Extended Data Figure 3:
Scatter plot comparing the beta values from GWAS where the phenotype was either GEM on all individuals (x-axis, n= 51,399) or GEM on individuals that did not have an mCA (n = 38,000). Genes are colored by the likely causal gene, which was manually curated. Variants shown have pvalue < 5 × 10⁻⁸ in at least one of the two GWAS.

