Figure 6:
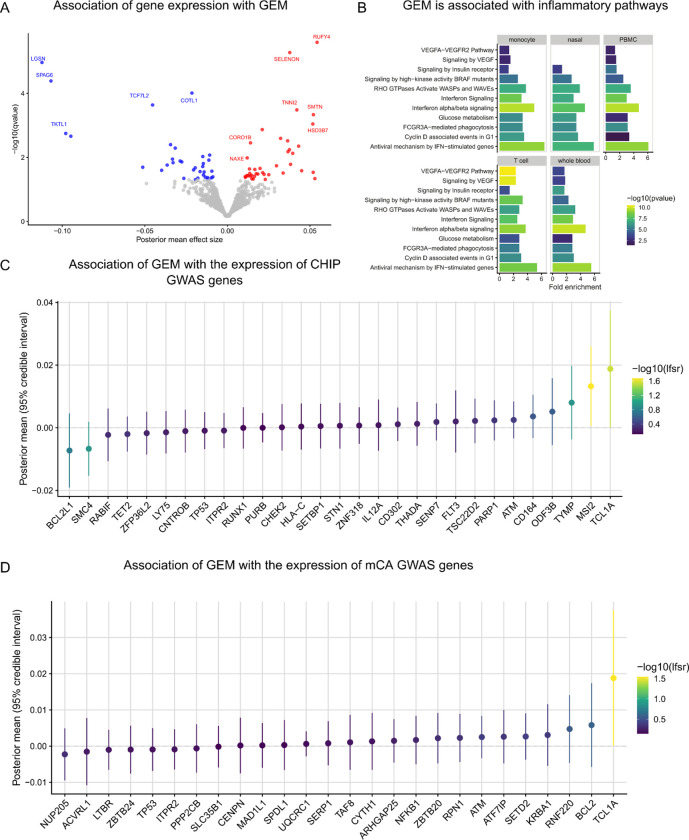
The transcriptomic correlates of GEM. A, Association analyses were performed between GEM and gene expression in whole blood, including age, sex, genotype PCs 1–5, and expression PCs 1–20 as covariates. B, Enrichment analyses were performed using pathfindR and KEGG pathways as reference. C, Association statistics among CHIP GWAS genes. D, Association statistics among mCA GWAS genes.

