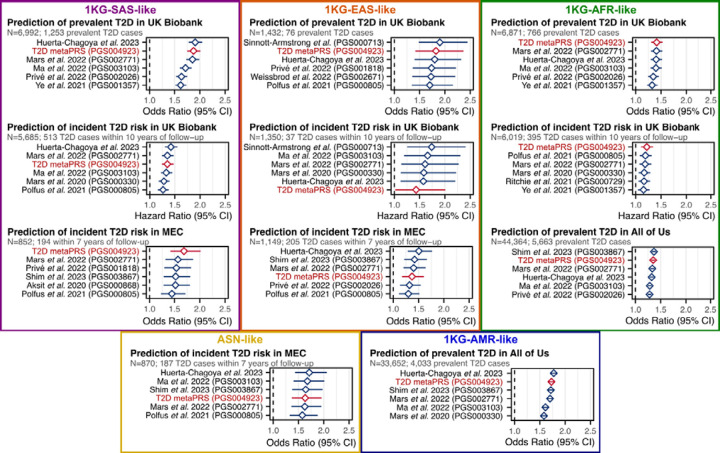
Figure 3: Top six T2D PRSs in people of five diverse ancestry groups across three cohorts.
Comparison of PRSs for association with T2D status or time-to-onset in participants clustering into five diverse ancestry groups from UK Biobank, the All of Us research program cohort, and the Singapore Multi-Ethnic Cohort (MEC). Participants in each cohort were clustered by genetic similarity with the 1KG reference population participants (Methods), except for ethnic Malays in the MEC study, as their genetic ancestries are distinct from and not represented by 1KG reference populations, and here labelled as Austronesian (ASN)-like to reflect their ancestral population histories. The top six PRS for each cohort and genetic ancestry group are shown; in UK Biobank incident and prevalent T2D were analysed separately due to significant difference in phenotype severity (Methods). Odds ratios and hazard ratios for all tested PRS are detailed in Table S7. PRSs were adjusted for 20 genetic principal components in each cohort prior to model fitting. Diamonds show the odds ratios or hazard ratios, and horizontal bars show the 95% confidence intervals. Odds ratios and hazard ratios are per standard deviation increase in the respective PC-adjusted PRS. Logistic and Cox proportional hazards regressions were adjusted for age, sex, and cohort specific covariates (e.g., assessment centre). Logistic regression was used to assess associations with incident T2D in MEC as time to T2D onset (or T2D-free survival) was not available due to the heterogeneity of incident T2D ascertainment (Methods). Note the Shim et al. 2023 PRS (PGS003867) could not be tested in UK Biobank as it was derived from multi-ancestry GWAS performed in UK Biobank samples.

