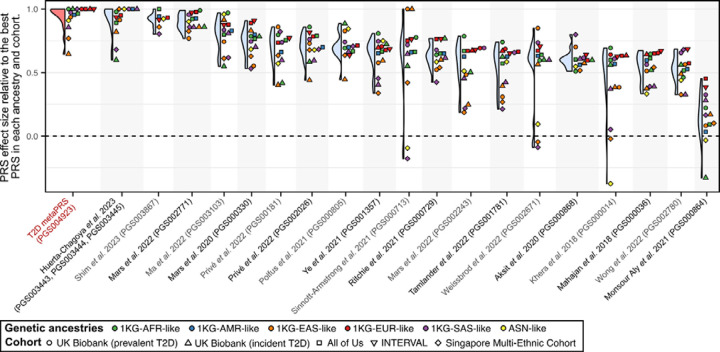
Figure 4: Relative rank of PRSs by effect size within each genetic ancestry and cohort.
Violin and dotplot comparing PRS effect size relative to the PRS with the maximum effect size within each cohort and genetic ancestry group. A score of 1.0 is given to the PRS with the maximum odds ratio or hazard ratio in each cohort and genetic ancestry combination. Other PRSs were then assigned a relative prediction value based on the ratio of their log odds ratio (or log hazard ratio) to that of the strongest PRS. PRS are ordered left to right based on their median score.

