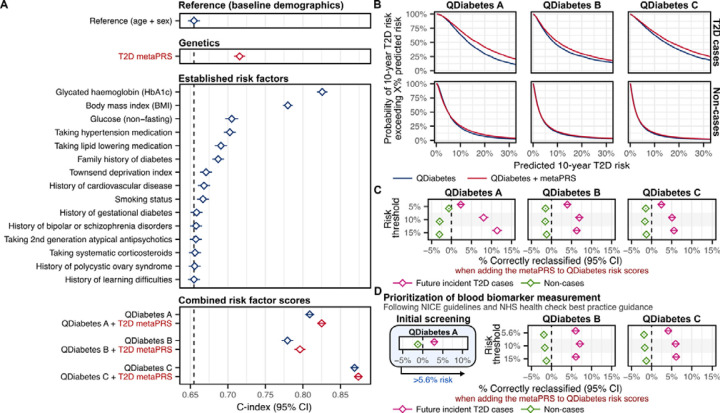
Figure 5: Comparison to established risk factors and risk prediction scores.
A) Comparison of C-index over age and sex alone for the metaPRS to individual type 2 diabetes risk factors and 10-year type 2 diabetes risk prediction scores (QDiabetes) in 190,293 1KG-EUR-like UK Biobank participants (4,064 incident T2D cases). The QDiabetes 2018 model A score is calculated from all listed individual risk factors, excepting glucose and HbA1c. The QDiabetes 2018 model B and model C scores additionally incorporates fasting glucose and HbA1c respectively. Note UK Biobank participants are non-fasting leading to likely underestimation of QDiabetes B. For comparison purposes the set of participants analysed here was selected as the subset in which the QDiabetes 2018 model C risk score could be computed (complete risk factor information, with height between 1.4 and 2.1 meters, weight ≤ 180 kg, and HbA1c between 15 and 48 mmol/mol). Diamonds show the C-index and horizontal bars show the 95% confidence intervals. C-indices and individual risk factor hazard ratios are detailed in Table S8. B) Probability of predicted 10-year risk exceeding X% when using QDiabetes risk with or without the T2D metaPRS. Probabilities were calculated as one minus the empirical cumulative distributive function across cases and non-cases combined. Probability curves extend to the right of each plot up, to 100% predicted risk, but are truncated here for clarity. C) Categorical net reclassification improvement (NRI) when adding the metaPRS to QDiabetes risk scores for stratifying participants into high and low risk groups at varying risk thresholds. % correctly reclassified: net % of cases that were correctly reclassified from the low-risk group into the high-risk group when adding the metaPRS (pink) or the net % of non-cases that were correctly reclassified from the high-risk group into the low-risk group when adding the metaPRS (green). 95% confidence intervals were estimated via a bootstrap sampling procedure with 1000 bootstraps. Diamonds show the net % correctly reclassified and horizontal bars show the 95% confidence intervals. Categorical NRI details and numbers allocated to each risk category are provided in Table S9. D) Categorical NRI when incorporating the metaPRS into a two-stage procedure in which QDiabetes model A is used to prioritize potential high-risk individuals for fasting glucose or HbA1c blood tests for subsequent risk prediction and stratification. Categorical NRI details and numbers allocated to each risk category are provided in Table S10.

