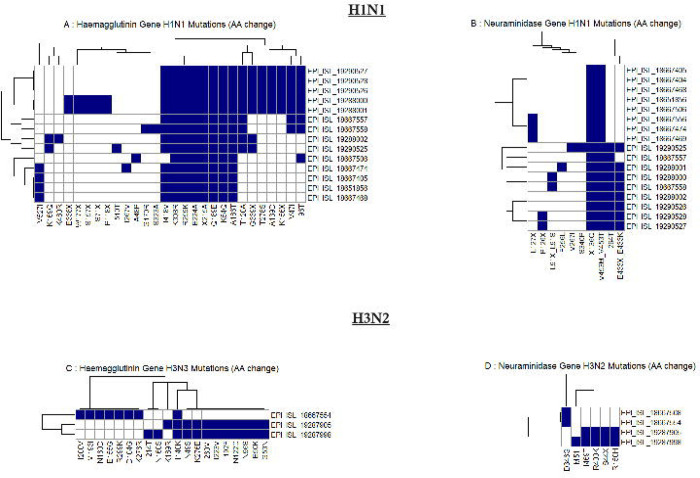
Figure 4: Heatmap of amino acid substitutions in hemagglutinin (HA) and neuraminidase (NA) genes of influenza A H1N1 and H3N2 viruses.
(Panels A and B show mutations in the HA and NA genes of H1N1, respectively, while panels C and D display mutations in the HA and NA genes of H3N2. Each row represents an individual virus sequence, identified by its GISAID EPI_ISL accession number, and each column represents a specific amino acid position where mutations have occurred. The presence of a mutation is indicated by a blue square, and the absence by a white square).

