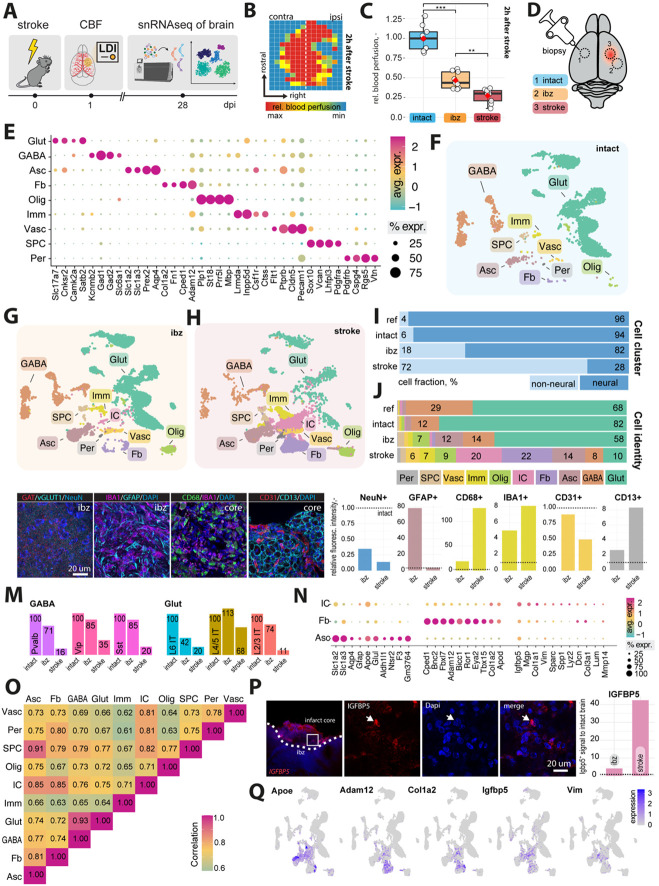
Fig 1: Cellular profiling of the stroke-injured mouse brain.
(A) Scheme of experimental workflow (B) Laser Doppler imaging (LDI) illustrating relative perfusion in the mouse brain (C) Bar plot showing quantification of relative blood perfusion in the stroke core and the ischemic border zone (ibz) compared to the left hemisphere acutely after stroke (D) Illustration of brain regions for biopsy to perform snRNAseq (E) Dot plot representation of canonical cell type markers across different cell populations from the intact contralesional hemisphere, labeled by cell type: glutamatergic neurons (Glut), GABAergic neurons (GABA), astrocytes (Asc), fibroblasts (FB), oligodendrocytes (Olig), immune cells (Imm), vascular cells (Vasc), stem/progenitor cells (SPC), and mural cells (Per) (F-H) UMAP visualization of cell clusters from intact, ibz and stroke tissue. (I) Bar plot showing distribution of cell type by neural and non-neural cells and individual cell types (J) across the reference, intact, ibz and stroke samples. (K) Representative histological overview of brain sections stained with (from left to right) Gat/vGlut, IBA1/GFAP, CD68/IBA1, CD31/CD13, co-stained with DAPI. (L) Quantification of NeuN+, GFAP+, IBA1+, CD68+, CD31+ and CD13+ expression relative to intact tissue (dotted line). (M) Bar graph showing relative amount of major GABA and glutamatergic neuronal subtypes. (N) Dot plot showing expression of canonical cell type marker of injury-associated cells (IC), FB, and Asc. (O) Heatmap showing correlation of gene expression profiles between each cell type from stroke tissue. (P) Representative histological overview of brain sections stained with IGFBP5 (left) and quantification of IGFBP5 expression relative to intact tissue (right). (Q) Feature plot showing the expression patterns of Apoe, Adam12, Cola1a2, and Vim in cells from stroke tissue. The data was generated with a cohort of n = 9 mice.

