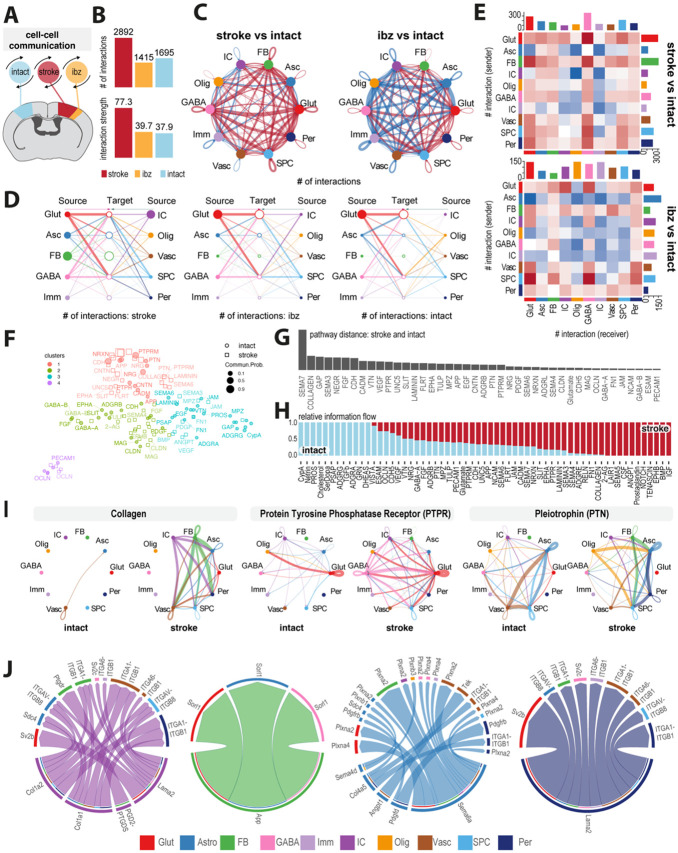
Fig 3: Mapping of intercellular molecular signaling post-stroke.
(A) Schematic of cell-cell interaction analysis (B) Bar plot showing number and strength of interactions in cells from intact, ibz and stroke tissue. (C) Network diagram contrasting total number of cell-cell interactions between individual cell types in stroke vs intact (left) and ibz vs intact (right). Red lines indicate increased interaction, blue lines indicate reduced interaction, relative to intact tissue. (D) Hierarchy plot of interaction between all individual cell types to target cells in stroke (left), ibz (middle) and intact (right) datasets. (E) Heatmap showing differential interactions between cell types from stroke vs intact (upper) and ibz vs intact tissue (lower). Red squares indicating increased signaling and blue squared indicating decreased signaling, relative to cells from intact tissue. (F) Scatter plot projecting signaling groups onto a 2D space according to their functional similarity between cells from stroke and intact tissue. (G) Bar plot showing signaling pathway distance between stroke and intact tissue (H) Stacked bar plot illustrating the proportional relative information flow in signaling pathways between intact and stroke tissue. (I) Cell-cell communication networks for selected pathways: COLLAGEN, Protein Tyrosine Phosphatase Receptor (PTPR), and Pleiotrophin (PTN) across cell types in intact (left) and stroke (right) tissue. (J) Chord diagrams showing the most upregulated signaling ligand-receptor pairings in injury-associated cells (IC), fibroblasts (FB), astrocytes (Asc), and pericytes (Per).

