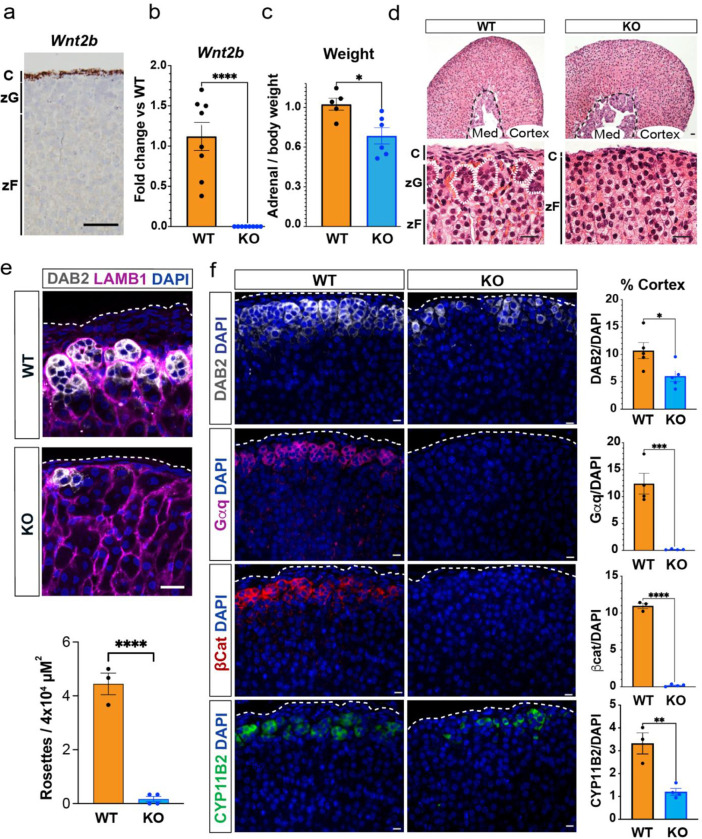
Figure 1. WNT2B deficiency results in a dysmorphic zG in mice.
a. Representative image of Wnt2b expression using single molecule in situ hybridization (smISH) from an adult female adrenal. Scale bar: 100μm. C, capsule; zG, zona glomerulosa; zF, zona fasciculata.
b. QRT-PCR was performed on WT and KO female adrenals (n=8 WT, n=8 KO). Two-tailed Student’s t-test. ****p < 0.0001. Data are represented as mean ± SEM.
c. Adrenal weight normalized to body weight from female mice (n=5 WT, n=6 KO). Two-tailed Student’s t-test. *p < 0.05. Data are represented as mean fold change ± SEM.
d. Representative H&E images of WT and KO female adrenals. Scale bar: 10μm. Dotted white line delineates rosette structures. C, capsule; zG, zona glomerulosa; zF, zona fasciculata. Med, medulla.
e. Representative image and quantification of immunohistochemistry from WT and KO female adrenals stained for Laminin β1 (LAMB1, magenta), indicating the basement membrane surrounding distinct clusters of zG cells (DAB2, gray; DAPI, blue). Scale bar: 20μm. Staining delineates individual glomeruli, highlighting the loss of rosettes in KO adrenals. The number of DAB2+ clusters containing ≥5 cells (n=3 WT, n=4 KO). Two-tailed Student’s t-test. ****p < 0.0001. Data are represented as mean ± SEM.
f. Representative images and quantification from female adrenals immunostained for DAB2 (gray, n=5 WT, n=5 KO), Gαq (magenta, n=4 WT, n=4 KO), β-catenin (β-cat, red, n=3 WT, n=4 KO) and CYP11B2 (green, n=3 WT, n=4 KO). Positive cells were quantified and normalized to nuclei (DAPI, blue) in the cortex. Scale bars: 10μm. Two-tailed Student’s t-test. *p < 0.05; **p < 0.01; ***p < 0.001; ****p < 0.0001. Data are represented as mean ± SEM.

