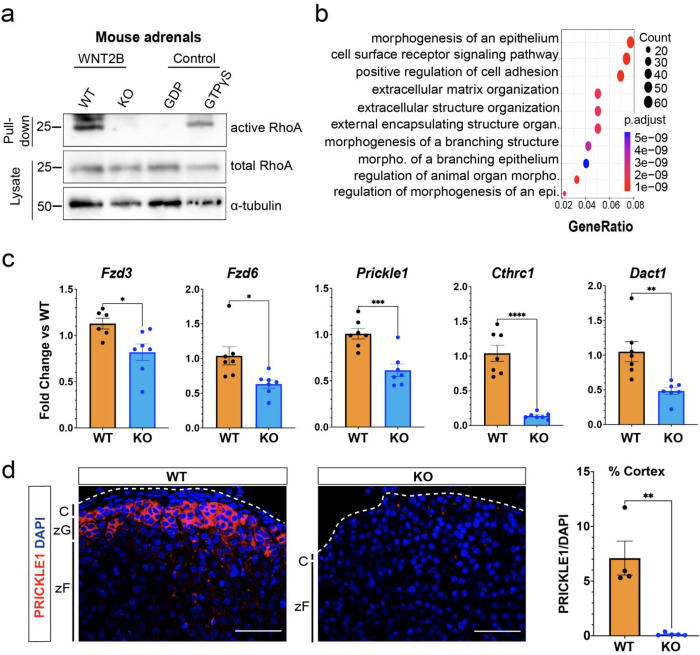
Figure 5. WNT2B deficiency disrupts Wnt/PCP signaling in the adrenal.
a. Activity of RhoA in WT and KO adrenals was assessed by Rhotekin-RBD pull-down assay using adrenal lysates. GTPγS and GDP treated adrenal lysates served as positive and negative controls, respectively. Total RhoA and α-tubulin served as loading controls.
b. Dot plot depicting Gene Ontology (GO) Gene Set enrichment analysis of genes downregulated in KO vs WT.
c. QRT-PCR was performed in WT and KO adrenals for Fzd3 (n=6 WT, n=7 KO), Fzd6 (n=7 WT, n=7 KO), Prickle1 (n=7 WT, n=7 KO), Cthrc1 (n=7 WT, n=7 KO) and Dact1 (n=7 WT, n=7 KO) from female mice. Two-tailed Student’s t-test. *p<0.05; **p < 0.01 ***p < 0.001; ***p < 0.0001. Data are represented as mean ± SEM.
d. Representative images and quantification from adrenals stained for PRICKLE1 (red, n=4 WT, n=5 KO). Positive cells were quantified and normalized to nuclei (DAPI, blue) in the cortex. Scale bars: 50μm. Two-tailed Student’s t-test. **p < 0.01. Data are represented as mean ± SEM. C, capsule; zG, zona glomerulosa; zF, zona fasciculata.

