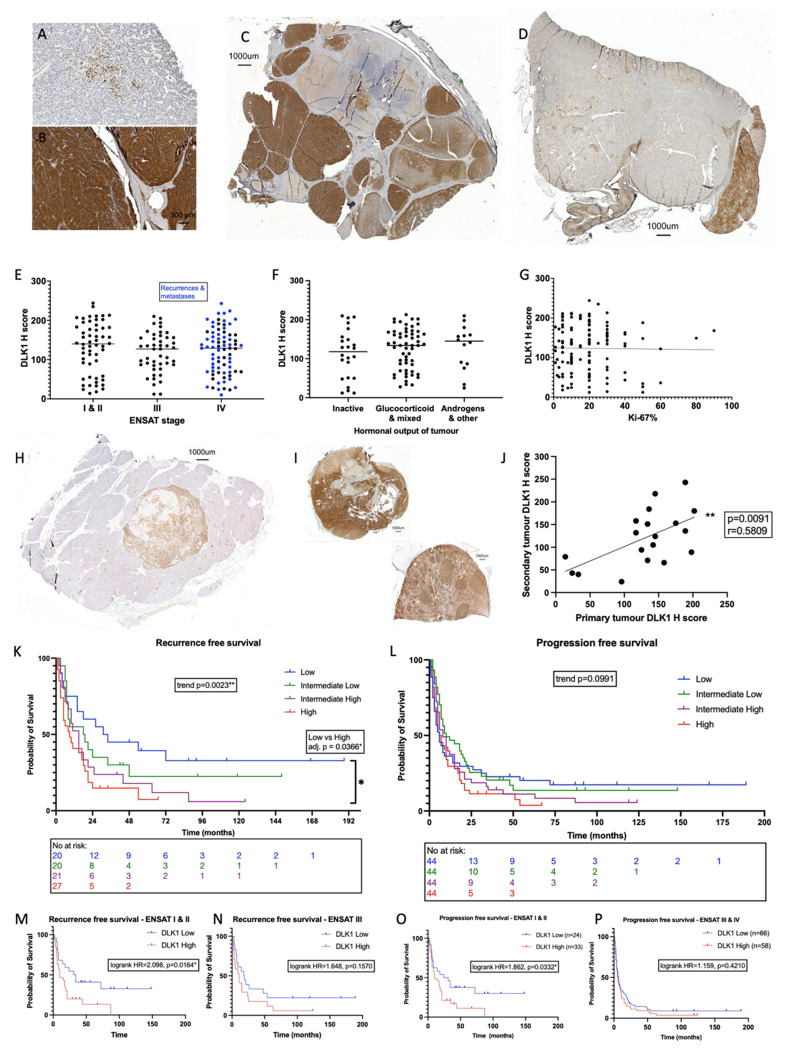
Figure 4. DLK1 expression is ubiquitous in human ACC, consistent in metastatic disease and increases risk of disease recurrence and progression.
A-G) The range of expression across the cohort can be seen with few positive cells in the tumor parenchyma (A) dense, intense staining throughout (B). C and D: panoramic sections illustrating heterogenous DLK1 expression in individual tumor samples. DLK1 expression is unrelated to ENSAT stage (E), hormonal output (F) or Ki-67% (G). H-J) DLK1 expression shown in a liver metastasis (H). DLK1 expression is positively correlated in primary and secondary disease in the same patients (I and J). Each dot represents a secondary tumor. K-L): Kaplan-Meier curves showing increased disease recurrence (K) and a trend towards increased disease progression (L) with higher DLK1 expression levels. This effect is more pronounced in ENSAT stage I & II disease (M, O) than in ENSAT stage III & IV disease (N, P). *p<0.05, **p<0.01.

