
Figure 5. Clone-specific transcriptional programs.
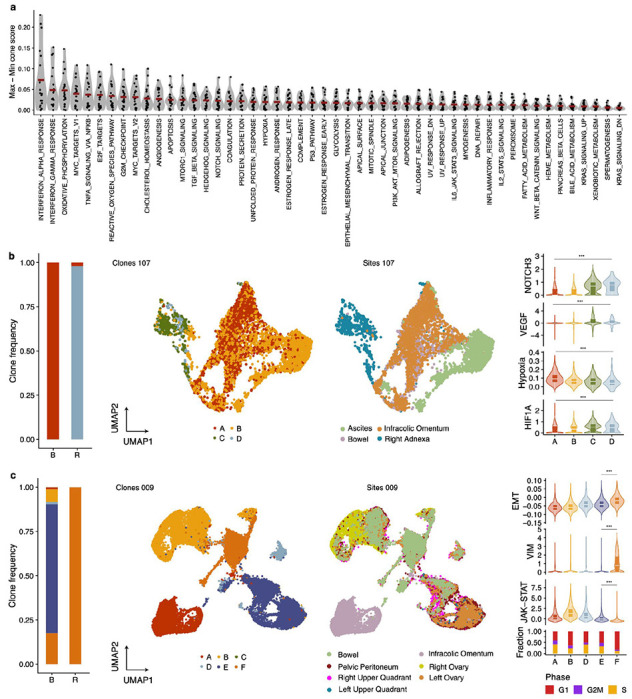
a) Hallmark pathway variability across genomically defined clones in scRNAseq data. Each data point represent the maximal pathway score difference between clones in each patient. Data from 20 patients included. b) From left to right, clone frequencies inferred from cfDNA at baseline (B) and recurrence (R) for OV-107. UMAPs labelled by sites and clone mapping (inferred using TreeAlign). Distribution of NOTCH3 expression, VEGF pathway, hypoxia and HIF1A across clones c) Clone frequencies inferred from cfDNA at baseline (B) and recurrence (R) for OV-009 UMAPs labelled by sites and clone mapping (inferred using TreeAlign). Distribution of EMT pathway, VIM expression, JAK-STAT pathway and fraction of cells in each cell cycle phase.