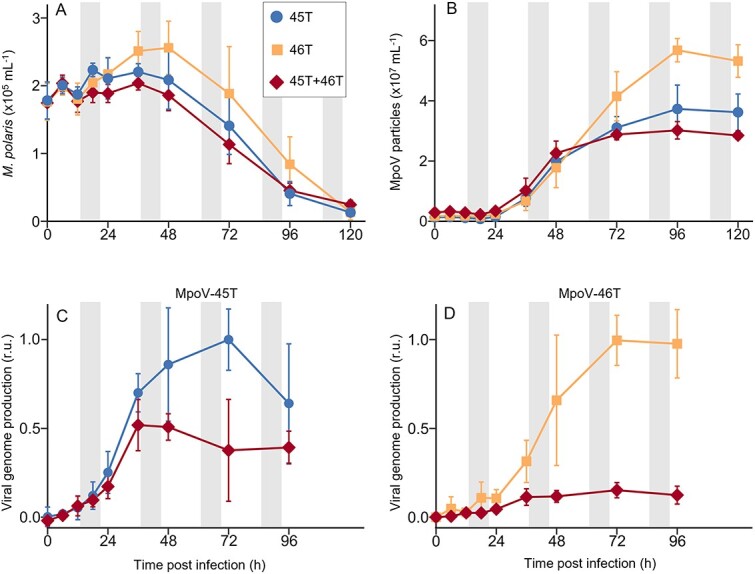
Figure 1.

Dual infection dynamics of Micromonas polaris with its viruses MpoV-45T and MpoV-46T, compared to single virus infection. (A), Micromonas polaris abundances and (B), MpoV particle dynamics obtained by flow cytometry. (C, D) viral genome production of MpoV-45T (C) and MpoV-46T (D). Viral genome abundances are min-max normalized with the respective single virus infection treatment as reference. Grey shaded areas indicate dark periods. Data show mean ± SD (with N = 6), based on two independent experiments with three replicates each, illustrating good reproducibility (see Fig. S1 for the infection dynamics per individual experiment).
