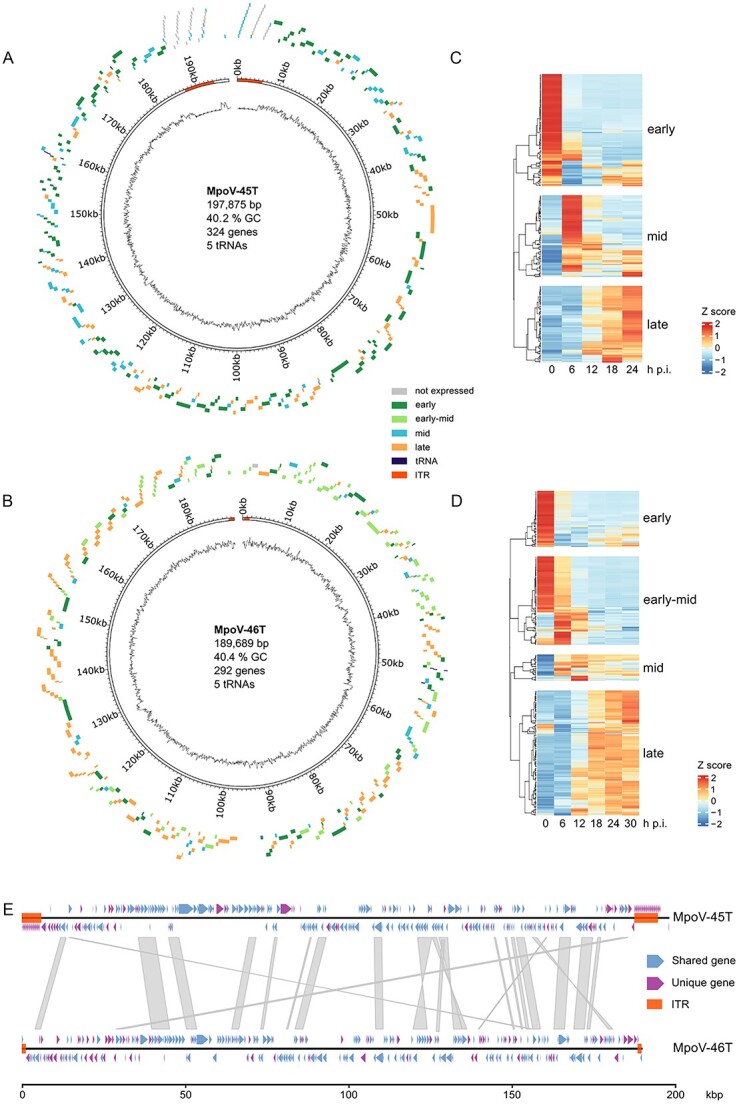
Figure 2.

Genomes of MpoV-45T and MpoV-46T. (A, B) circular representation [78] of the MpoV-45T genome (A) and MpoV-46T genome (B), with gene loci represented as blocks outside of the circle and colored according to their kinetic class in single infection. The line at the centre of the circle represents the GC content throughout the genome (window size = 300 bp). Segments at either ends of the genome indicate the ITR positions. Genome metrics are given at the centre of the circle. (C, D) gene expression heatmap, made using ComplexHeatmap [62] in R, showing kinetic classes of MpoV-45T (C) and MpoV-46T (D) in the single-infection treatments. Expression values have been averaged across timepoint replicates, centered and scaled. (E) genome synteny between MpoV-45T and MpoV-46T, made using gggenomes [79] in R. Red blocks indicate ITR positions, and colored arrows show gene loci and whether an ortholog of the gene exists in the other virus or not. Grey blocks between the genomes denote areas of DNA sequence homology as determined by a Minimap2 [80] alignment with the parameters -X,-N 50 and -p 0.1.
