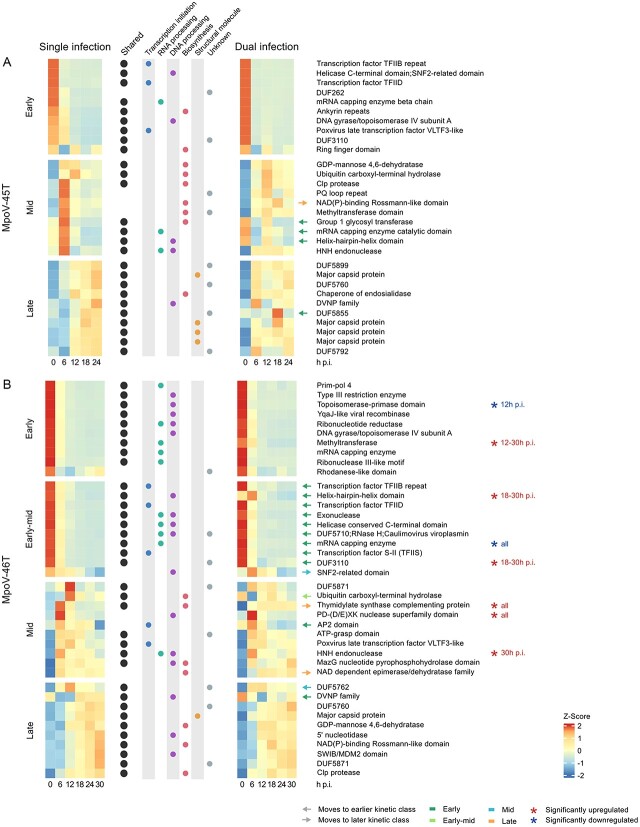
Figure 3.
Top ten expressed and annotated genes in single and dual infection experiments in each kinetic class for MpoV-45T (A) and MpoV-46T (B). Mean expression values per timepoint are centered and scaled. Genes with orthologs in MpoV-45T are marked with a black circle. Information on gene function is given in the central columns with colored circles. Genes which switch to a different kinetic class in dual infection are indicated with arrows colored according to the kinetic class they move to. Genes that are significantly up- or downregulated in dual infection compared to single infection are denoted with asterisks.

