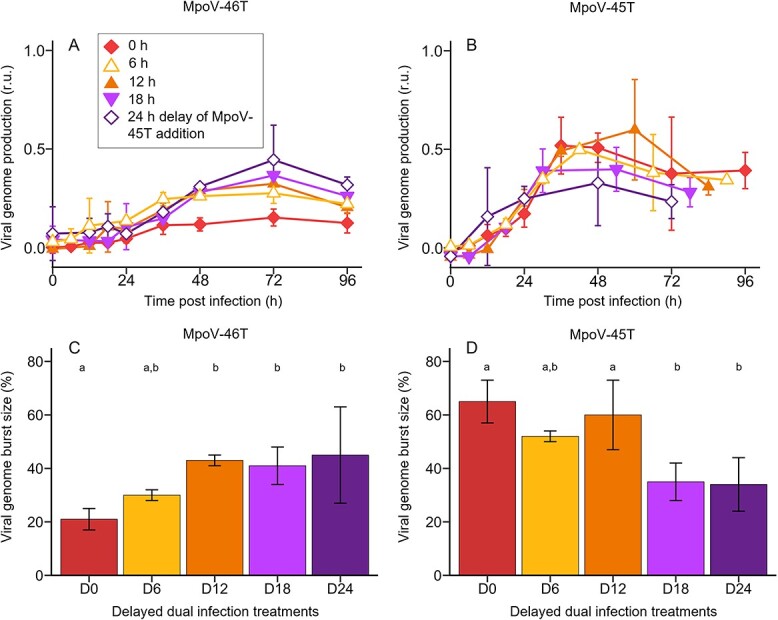
Figure 4.

Viral genome production and burst size for the delay treatments, in which MpoV-45T is added to a culture infected with MpoV-46T at the same time (D0) and 6, 12, 18, and 24 h later (D6, D12, D18, D24). (A, B) temporal dynamics of viral genome production of MpoV-46T (A) and MpoV-45T (B), in dual infection treatments in which MpoV-45T is added 0, 6, 12, 18, and 24 h after infection with MpoV-46T. The virus growth curves all start the moment of infection. For the delayed infection with MpoV-45T (B) this means that the delay time is subtracted. Viral genome production is min-max normalized with the respective single virus infection treatment as reference. (C, D) viral genome burst size (defined as the number of genome copies produced per lysed host cell) in the delayed dual infection treatments relative to the single infection treatment (i.e., expressed as percentage of single infection), for MpoV-46T (C) and MpoV-45T (D). Results are shown as averages ± standard derivation (N = 3, except for D0 where N = 6). Bars labelled with different letters indicate significant differences, as tested by a one-way ANOVA followed by multiple comparison of means using Tukey’s HSD test (with family-wise error rate of <0.05).
