Figure 5.

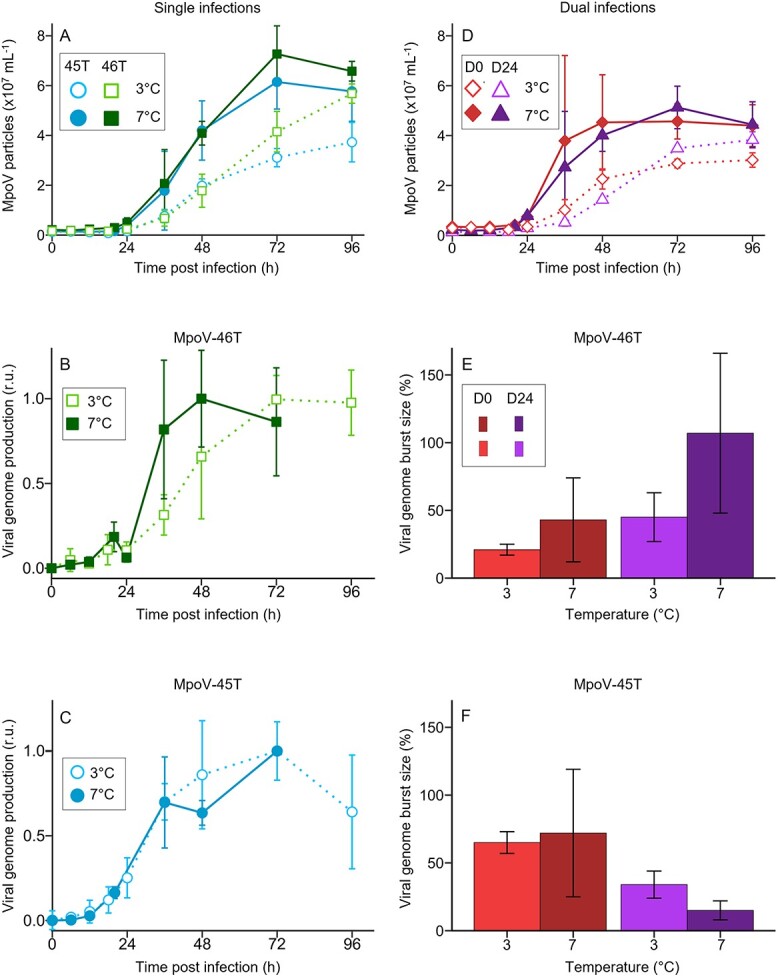
Comparison of the infection dynamics at two different temperatures (3°C and 7°C). (A) MpoV particle abundances during single infection at 3°C (dotted line, open symbol) vs 7°C (solid line, closed symbol). (B) MpoV-46T viral genome production at 3°C vs 7°C. (C) MpoV-45T viral genome production at 3°C vs 7°C. Viral genome production is min-max normalized with the respective single virus infection treatment as reference. (D) MpoV particle abundances at 3°C vs 7°C during dual infection without delay (D0) and with 24 h delayed (D24) addition of MpoV-45T. (E, F) viral genome burst size (defined as the number of genome copies produced per lysed host cell; and expressed as percentage of single infection) of MpoV-46T (E) and MpoV-45T (F) at 3°C and 7°C during dual infection without delay (D0) and with 24 h delayed (D24) addition of MpoV-45T. Results are shown as mean ± SD (N = 3 except for 3°C single and non-delayed dual treatment where N = 6).
