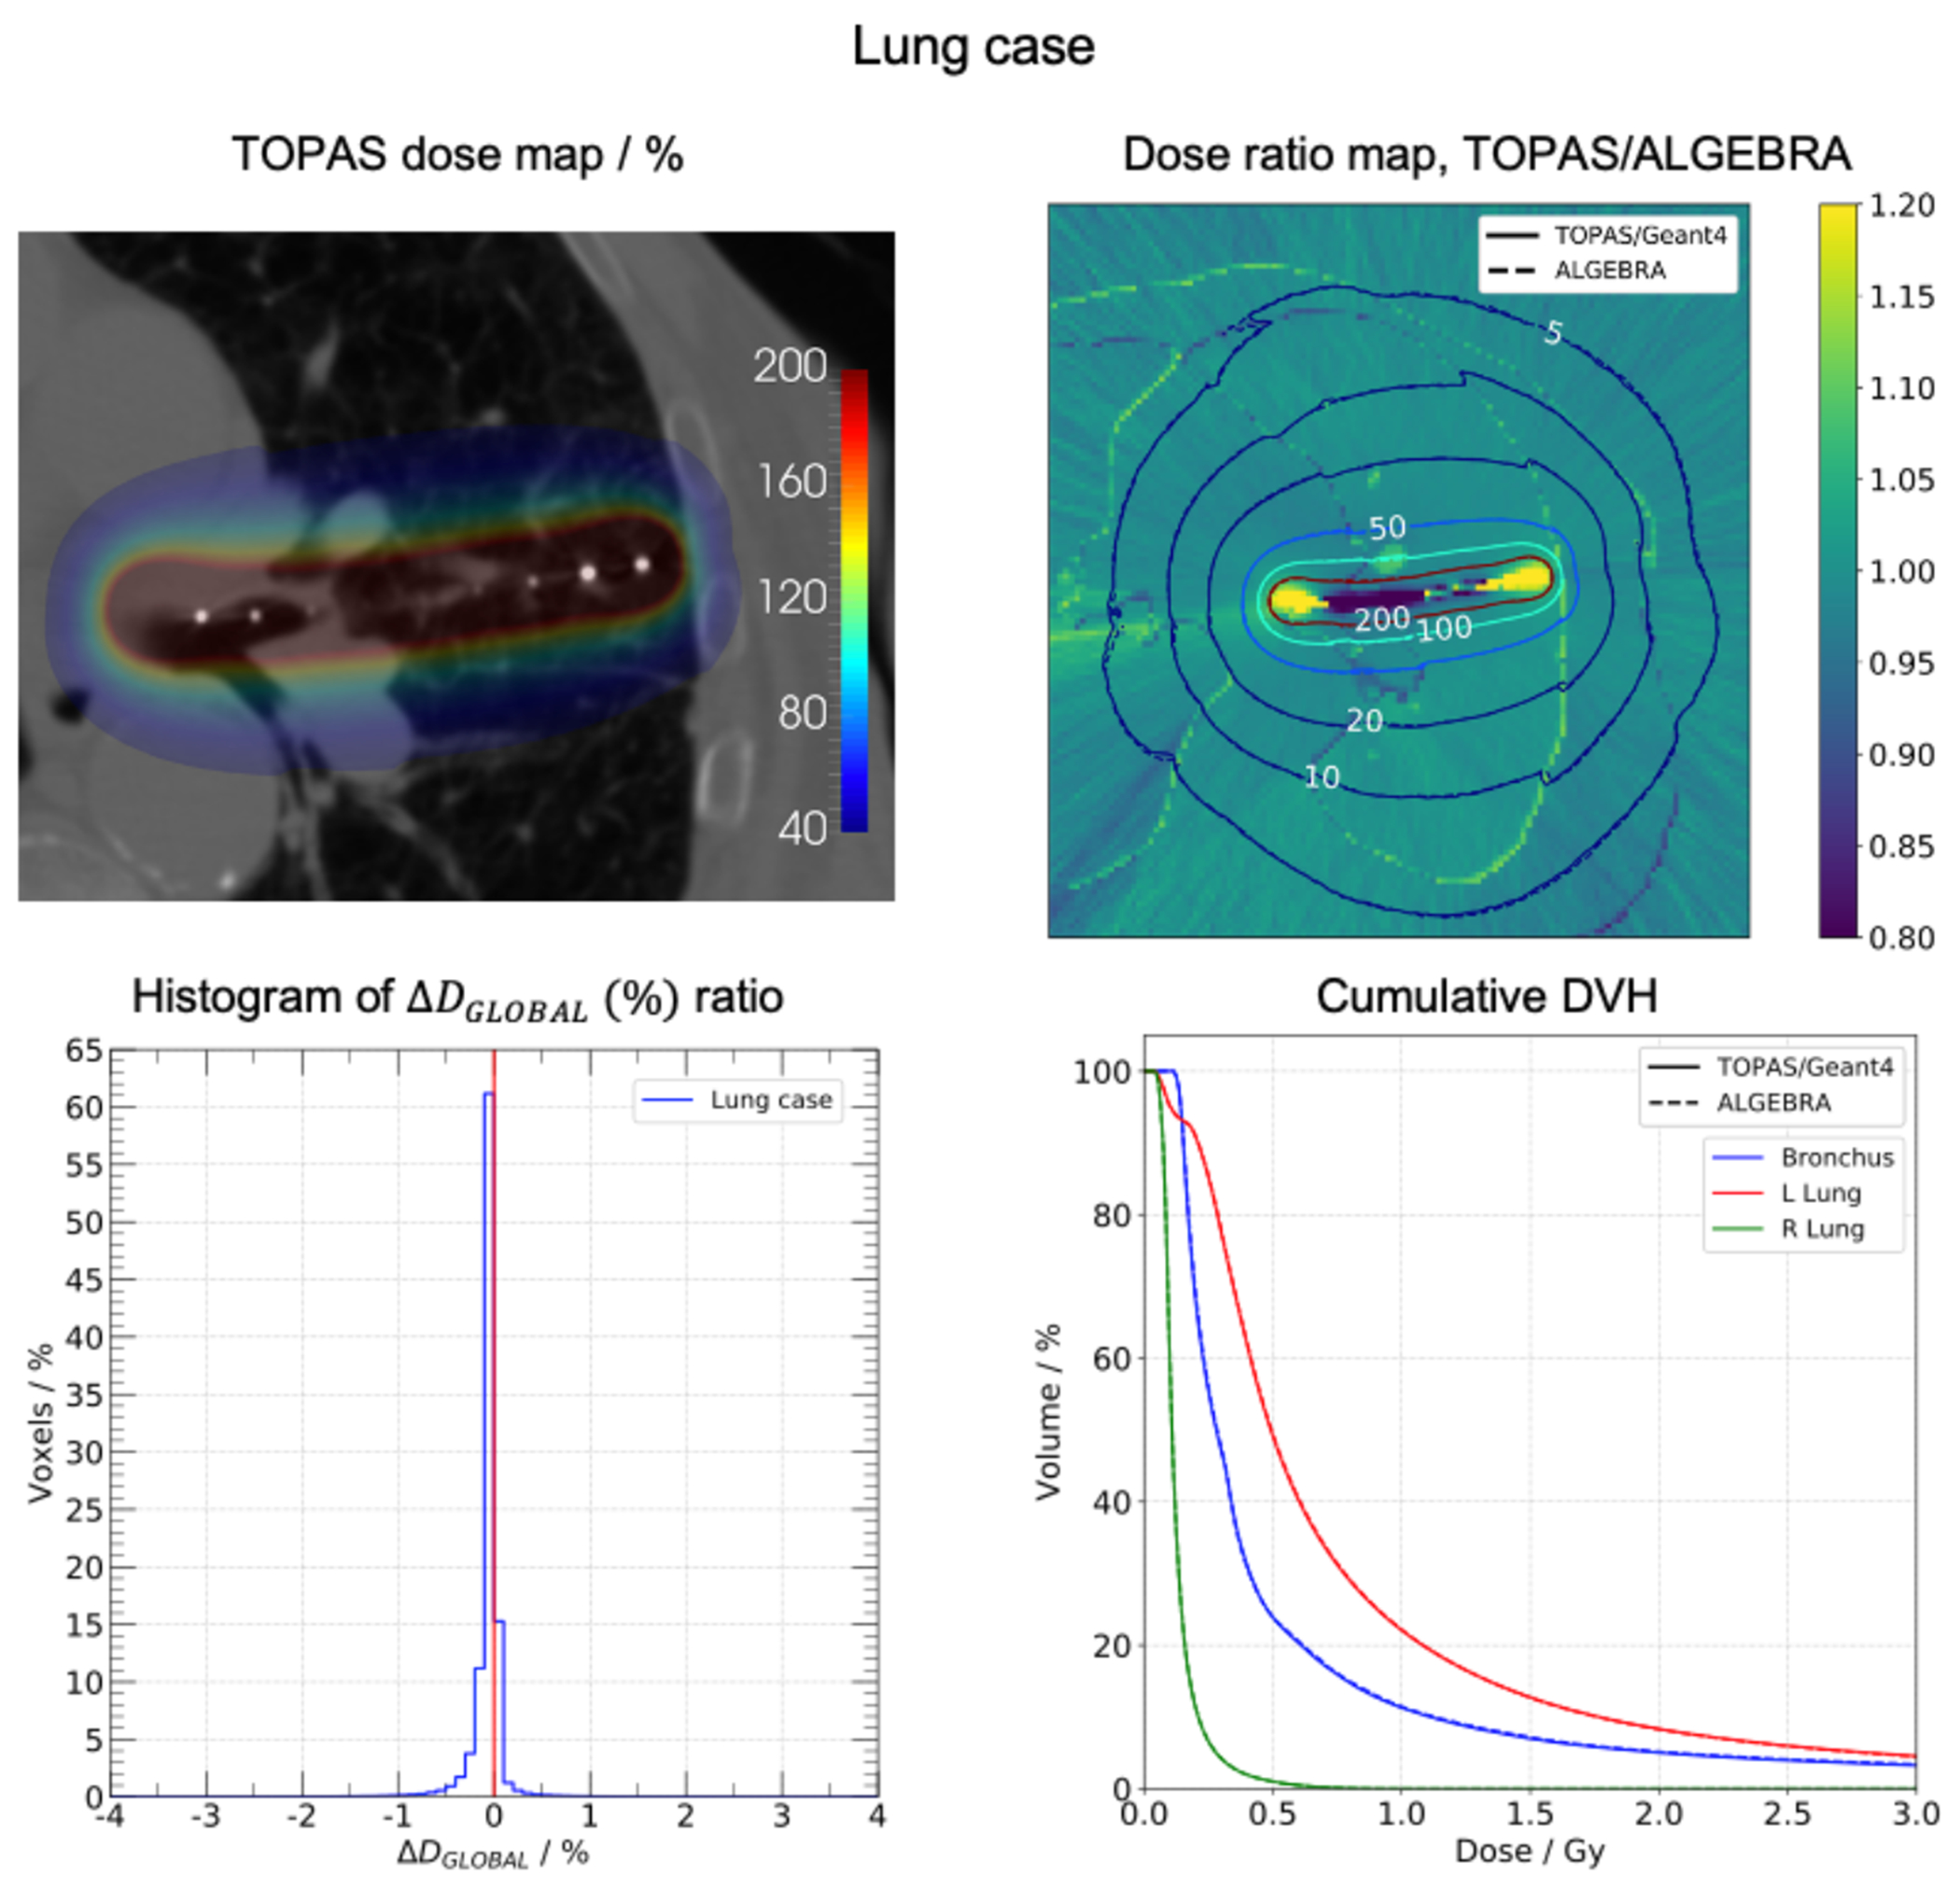
FIGURE 5.

Lung case. Top-left: dose map obtained with TOPAS. Top-right: dose ratio map TOPAS/ALGEBRA, the isodose lines of each dose map are shown. Bottom-left panel: histogram of (%) ratio. Bottom-right panel: cumulative DVH for segmented structures.
