Figure 3.

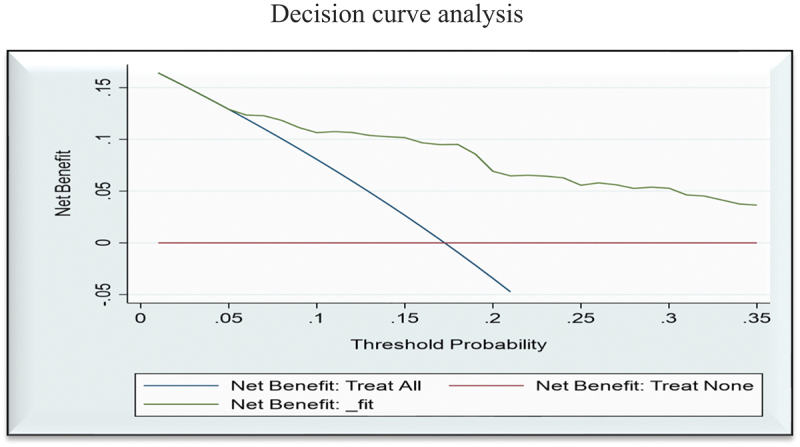
Decision curve plots the model’s net benefit against the threshold probability for clinical utilization of high-risk neonates in public hospitals of Amhara regional state, Northwest Ethiopia, 2021 (n=365).

Decision curve plots the model’s net benefit against the threshold probability for clinical utilization of high-risk neonates in public hospitals of Amhara regional state, Northwest Ethiopia, 2021 (n=365).