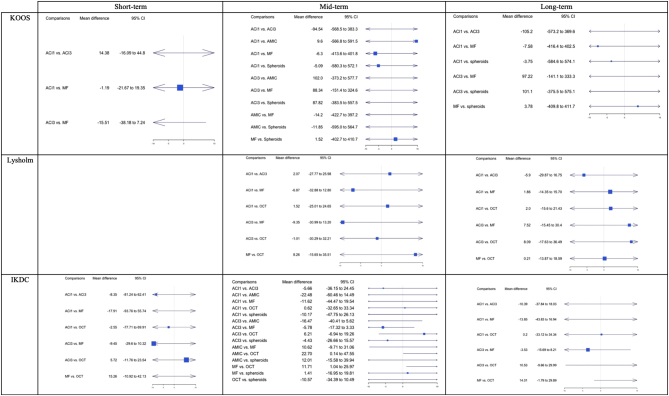
Figure 3.
Forest plots of the most used clinical scores. There were no available studies using Lysholm over the short term. In forest plots, no difference for the mean differences corresponds to 0. The I2 for KOOS: over short term 25%, mid-term 8%, long term 10%. The I2 for Lysholm: mid-term 16%, long term 15%. The I2 for IKDC: at short term 16%, mid-term 2%, long term 2%. ACI1, autologous chondrocyte implantation with periosteal membrane; ACI2, autologous chondrocyte implantation with collagen membrane; ACI3, autologous chondrocyte implantation with scaffold; AMIC, autologous matrix-induced chondrogenesis; MF, microfracture; OA, osteoarthritis; OCT, osteochondral transplantation; spheroids refer to chondrospheres.

 This work is licensed under a