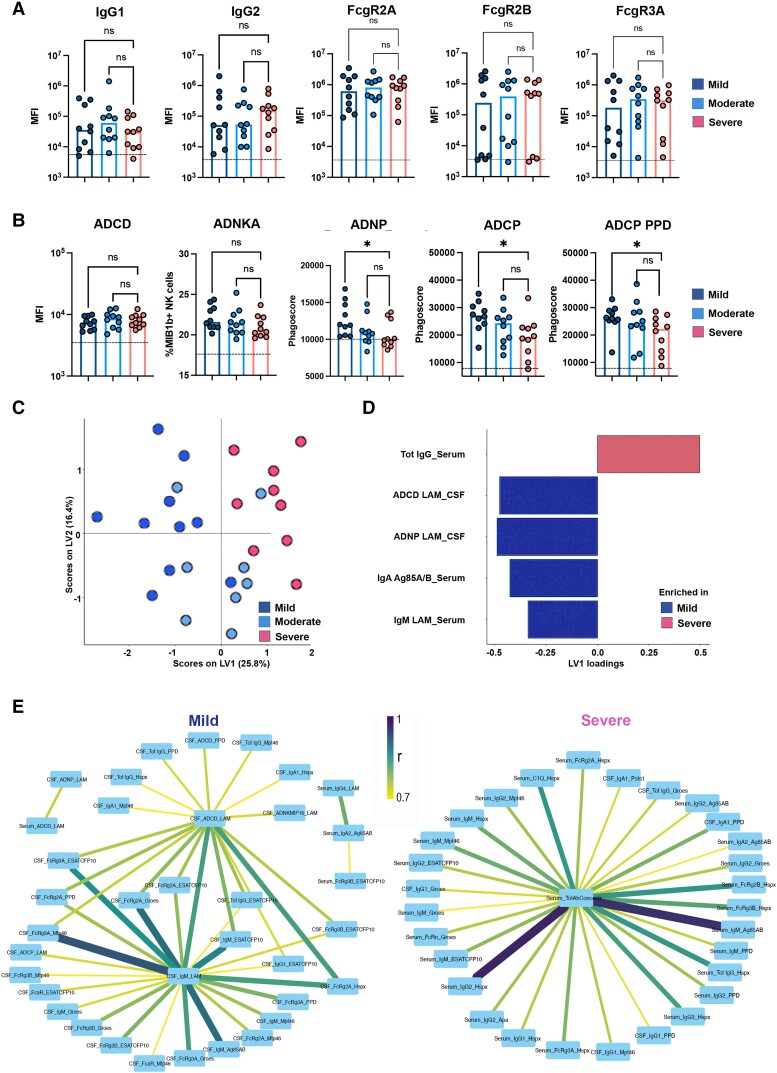
Figure 3.
Mtb-antibody responses are associated with disease severity of tuberculosis meningitis. (A and B) Scatter-dot plot showing lipoarabinomannan (LAM)-specific IgG1 and IgG2, binding to FcγR2A, FcγR2B, FcγR3A, antibody-mediated functions [THP-1 monocyte phagocytosis (antibody-dependent cellular phagocytosis, ADCP), antibody-dependent neutrophil phagocytosis (ADNP), antibody-dependent complement deposition (ADCD) and antibody-dependent natural killer cell activation (ADNKA)] and purified protein derivative (PPD)-specific ADCP in tuberculosis meningitis (TBM; n = 30) according to severity (mild = dark blue; moderate = light blue; severe = pink). Milder TBM disease showed higher levels of antibodies mediating ADCP (LAM- and PPD-specific) and ADNP (LAM-specific), despite having similar levels of IgG and FcγR binding. Each dot represents an individual. Bars represent median, dotted line indicates PBS level. Kruskal–Wallis statistics; **P < 0.01, ***P < 0.001, ****P < 0.0001. (C) Orthogonalized partial least squares regression (OPLSR) on least absolute shrinkage selection operator (LASSO)-selected features showing separation between antibody signatures depending on severity of TBM (mild = dark blue; moderate = light blue; severe = pink). Dots represent individual samples (n = 30) across all tested Mtb antigens (LAM, PPD, Ag85 A/B, ESAT/CFP10, PstS1, Hspx, Apa, Mtp46 and GroES). The performance of the algorithm was evaluated with R2 and Q2 metrics. R2 = 0.69 indicating a high predictive accuracy and Q2 = 0.55 indicating a good performance on test data in the cross-validation setting. (D) Bar graph shows LASSO-selected antibody features across Mtb antigens (LAM, PPD, Ag85 A/B, ESAT/CFP10, PstS1, Hspx, Apa, Mtp46, GroES) in TBM individuals (n = 30) according to severity of the disease (mild = blue; severe = pink), ranked by their variable importance in projection (VIP). Bars represent antibody features enriched in mild (blue) versus severe (pink). (E) Correlation network between LASSO-selected antibody features enriched in severe (Total IgG_Serum) or mild disease (ADCD_LAM_CSF; ADNP_LAM_CSF; IgA_Ag85_A/B Serum; IgM_LAM_Serum) and the remainder of features, including Ig classes and subclasses (Total IgG, IgG1, IgG2, IgG3, IgG4, IgM, IgA), Fc receptor (FcγR2A, FcγR2B, FcγR3A, FcγR3B, FcαR) and C1q binding, and functions (ADCD, ADCP, ADNP, NK CD107, NK IFNγ, NK MIP1β). Edge colour and size are proportional to the strength of correlation as shown in the colour bar. Only correlations with Spearman’s ρ > 0.7 and P < 0.01 are shown. Statistics: Z-scores, Spearman’s correlation, Benjamini–Hochberg correction for multiple comparisons.

