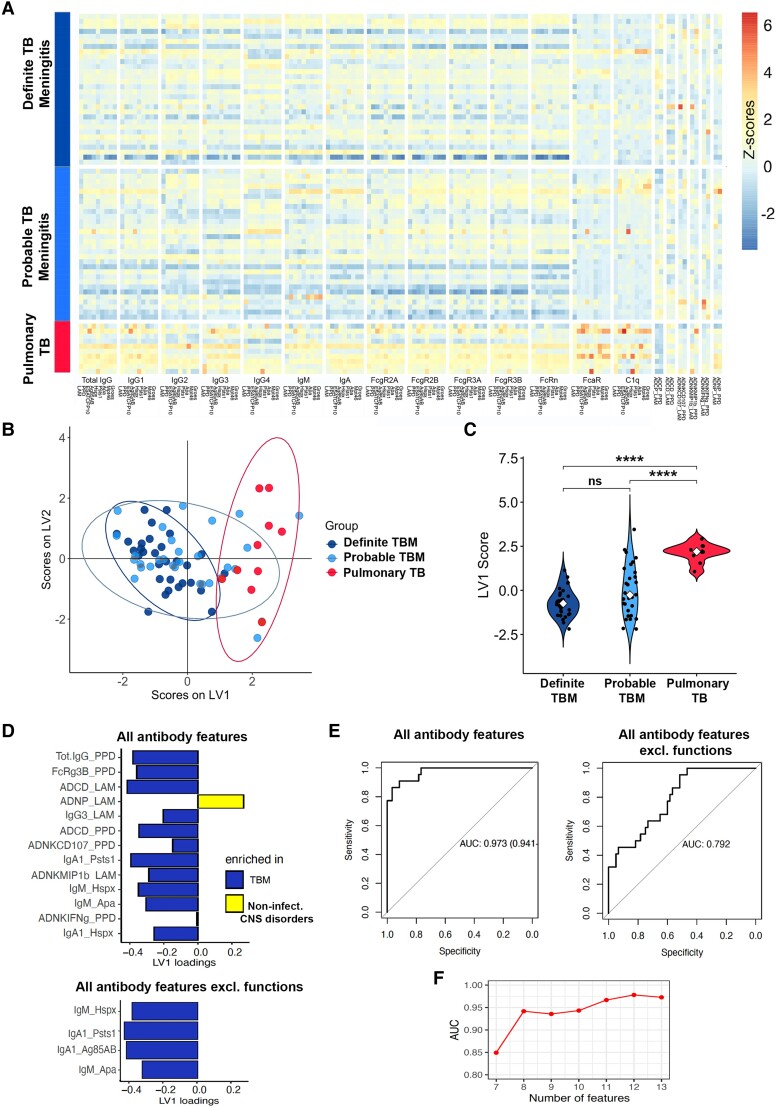
Figure 5.
Similar serum antibody signatures between definite and probable tuberculosis meningitis (TBM) and performance of a potential diagnostic test using CSF antibody signatures that distinguish TBM from non-infectious CNS disorders. (A) Heatmap of Ig classes (IgG, IgM, IgA), binding to Fc receptors (FcRs; FcγR2A, FcγR2B, FcγR3A, FcγR3B, FcαR) and C1q, and antibody-mediated functions [complement deposition (antibody-dependent complement deposition, ADCD), neutrophil phagocytosis (antibody-dependent neutrophil phagocytosis, ADNP), THP-1 monocyte phagocytosis (antibody-dependent cell phagocytosis, ADCP) and natural killer (NK) cell activation (antibody-dependent NK activation, ADNKA; ADNK CD107, IFNg, MIP1b)], across all tested Mtb antigens [lipoarabinomannan (LAM), purified protein derivative (PPD), Ag85 A/B, Hspx, ESAT/CFP10, Psts1, Apa, Mtp46 and GroES] in definite (n = 30) and probable (n = 25) TBM, compared with pulmonary TB (n = 10). Z-scored values, colour-coded from dark blue (negative z-scores) to yellow and red (positive z-scores). (B) Partial least square discriminant analysis (PLSDA) on least absolute shrinkage selection operator (LASSO)-selected features showing separation between antibody signatures in pulmonary TB (red, n = 10) and probable TBM (light blue, n = 25). The graph has been overlapped with the PLSDA model showing separation between pulmonary TB (red) and definite TBM (dark blue, n = 30), to show the large overlap between probable and definite TBM individuals. Dots represent individual samples across all tested Mtb antigens (LAM, PPD, Ag85 A/B, ESAT/CFP10, Psts1, Hspx, Apa, Mtp46 and GroES). (C) Violin plots show latent variable 1 (LV1) scores from PLSDA model across pulmonary TB (red, n = 10) and definite (dark blue, n = 30) or probable (light blue, n = 25) TBM. Kruskal–Wallis statistics; ****P < 0.0001, ns = not significant. (D) Bar graph shows LASSO-selected antibody features across Mtb antigens (LAM, PPD, Ag85 A/B, ESAT/CFP10, PstS1, Hspx, Apa, Mtp46 and GroES) in TBM individuals (definite and probable) compared with non-infectious CNS disorders, ranked by their Variable Importance in Projection (VIP) scores. Bars represent antibody features enriched in TBM (blue) versus non-infectious CNS disorders (yellow) when considering all antibody features (top, 13 features selected) or all features except functions (bottom, four features selected). (E) Receiver operating characteristic (ROC) curves illustrating the performance, in terms of area under the curve (AUC) for sensitivity and specificity, of a potential diagnostic test discriminating TBM (definite and probable) from non-infectious CNS disorders, using the LASSO-selected features from D as biomarkers. The ROC curve using the 13 LASSO-selected features (from the ‘all antibody features’ model) shows excellent performance (AUC 0.97, left). The ROC curve using the four LASSO-selected features (from the ‘all antibody features except functions’ model) shows good performance (AUC 0.79, right). (F) AUC values of ROC curves from the ‘all antibody features’ model in D using seven antibody classes/subclasses and FcR-binding features, among the 13 LASSO-selected features, and adding the functions one by one in order of their VIP scores. In this model, adding the first function (ADCD_LAM) improves the AUC from 0.85 to 0.95, whereas adding the following five functions (ADNP_LAM; ADCD_PPD; ADNK_CD107a_PPD; ADNK_MIP1b_LAM; and ADNK_IFNg_PPD) results in only a minor change in the AUC (plateau).

