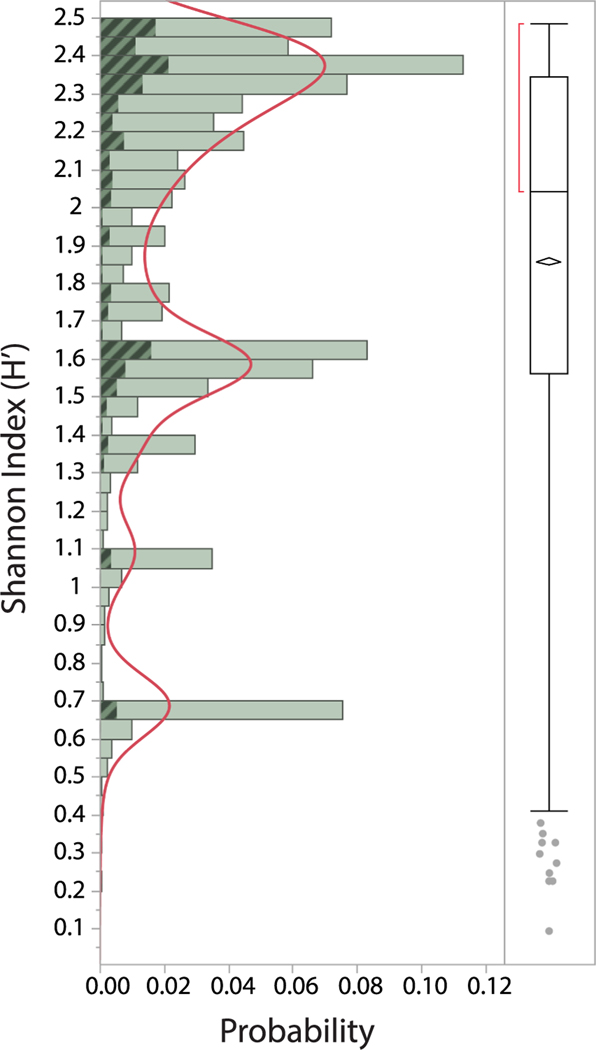
Fig. 7.
Frequency distribution of gene families based on their Shannon Index (H’). A non-parametric density curve highlights four broadly defined classes of genes. The fraction of disease-associated gene families are shaded. The horizontal line within the box plot depicts the median index value, while the diamond depicts the upper and lower 95% of the mean. The ends of the box represent the 25th and 75th quantiles, while the brackets outside of the box identify the densest 50% of the observations.

