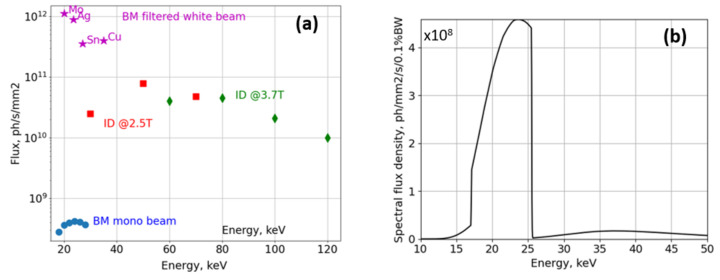
Figure 2.
(a) Comparison of typical photon flux density in white and monochromatic beams at the sample position. Values are measured with an ionization chamber and a radiometer for the BMIT-BM and BMIT-ID beamlines, respectively; measurements in the 15–60 keV range are in a very good agreement with those made with a diode calibrated at BAMline (BESSY II, Germany). Star-shaped markers show integrated flux in the filtered white beam. The letters next to each star-shaped marker indicate the material of the filter used to shape the radiation spectrum and each star is positioned at the weighted mean energy of the resulting polychromatic beam. Panel (b) shows the effective spectrum of the BMIT-BM beam filtered by a 0.1 mm-thick Ag filter and registered by a 20 µm-thick LuAG scintillator [computed with the help of the XRT software package (Klementiev & Chernikov, 2014 ▸)]. Note that for such a thin scintillator more than 95% of the detected photons are confined in the ∼17–25 keV spectral range and the flux density is about 2 × 10¹¹ photons mm−2 s−1.

