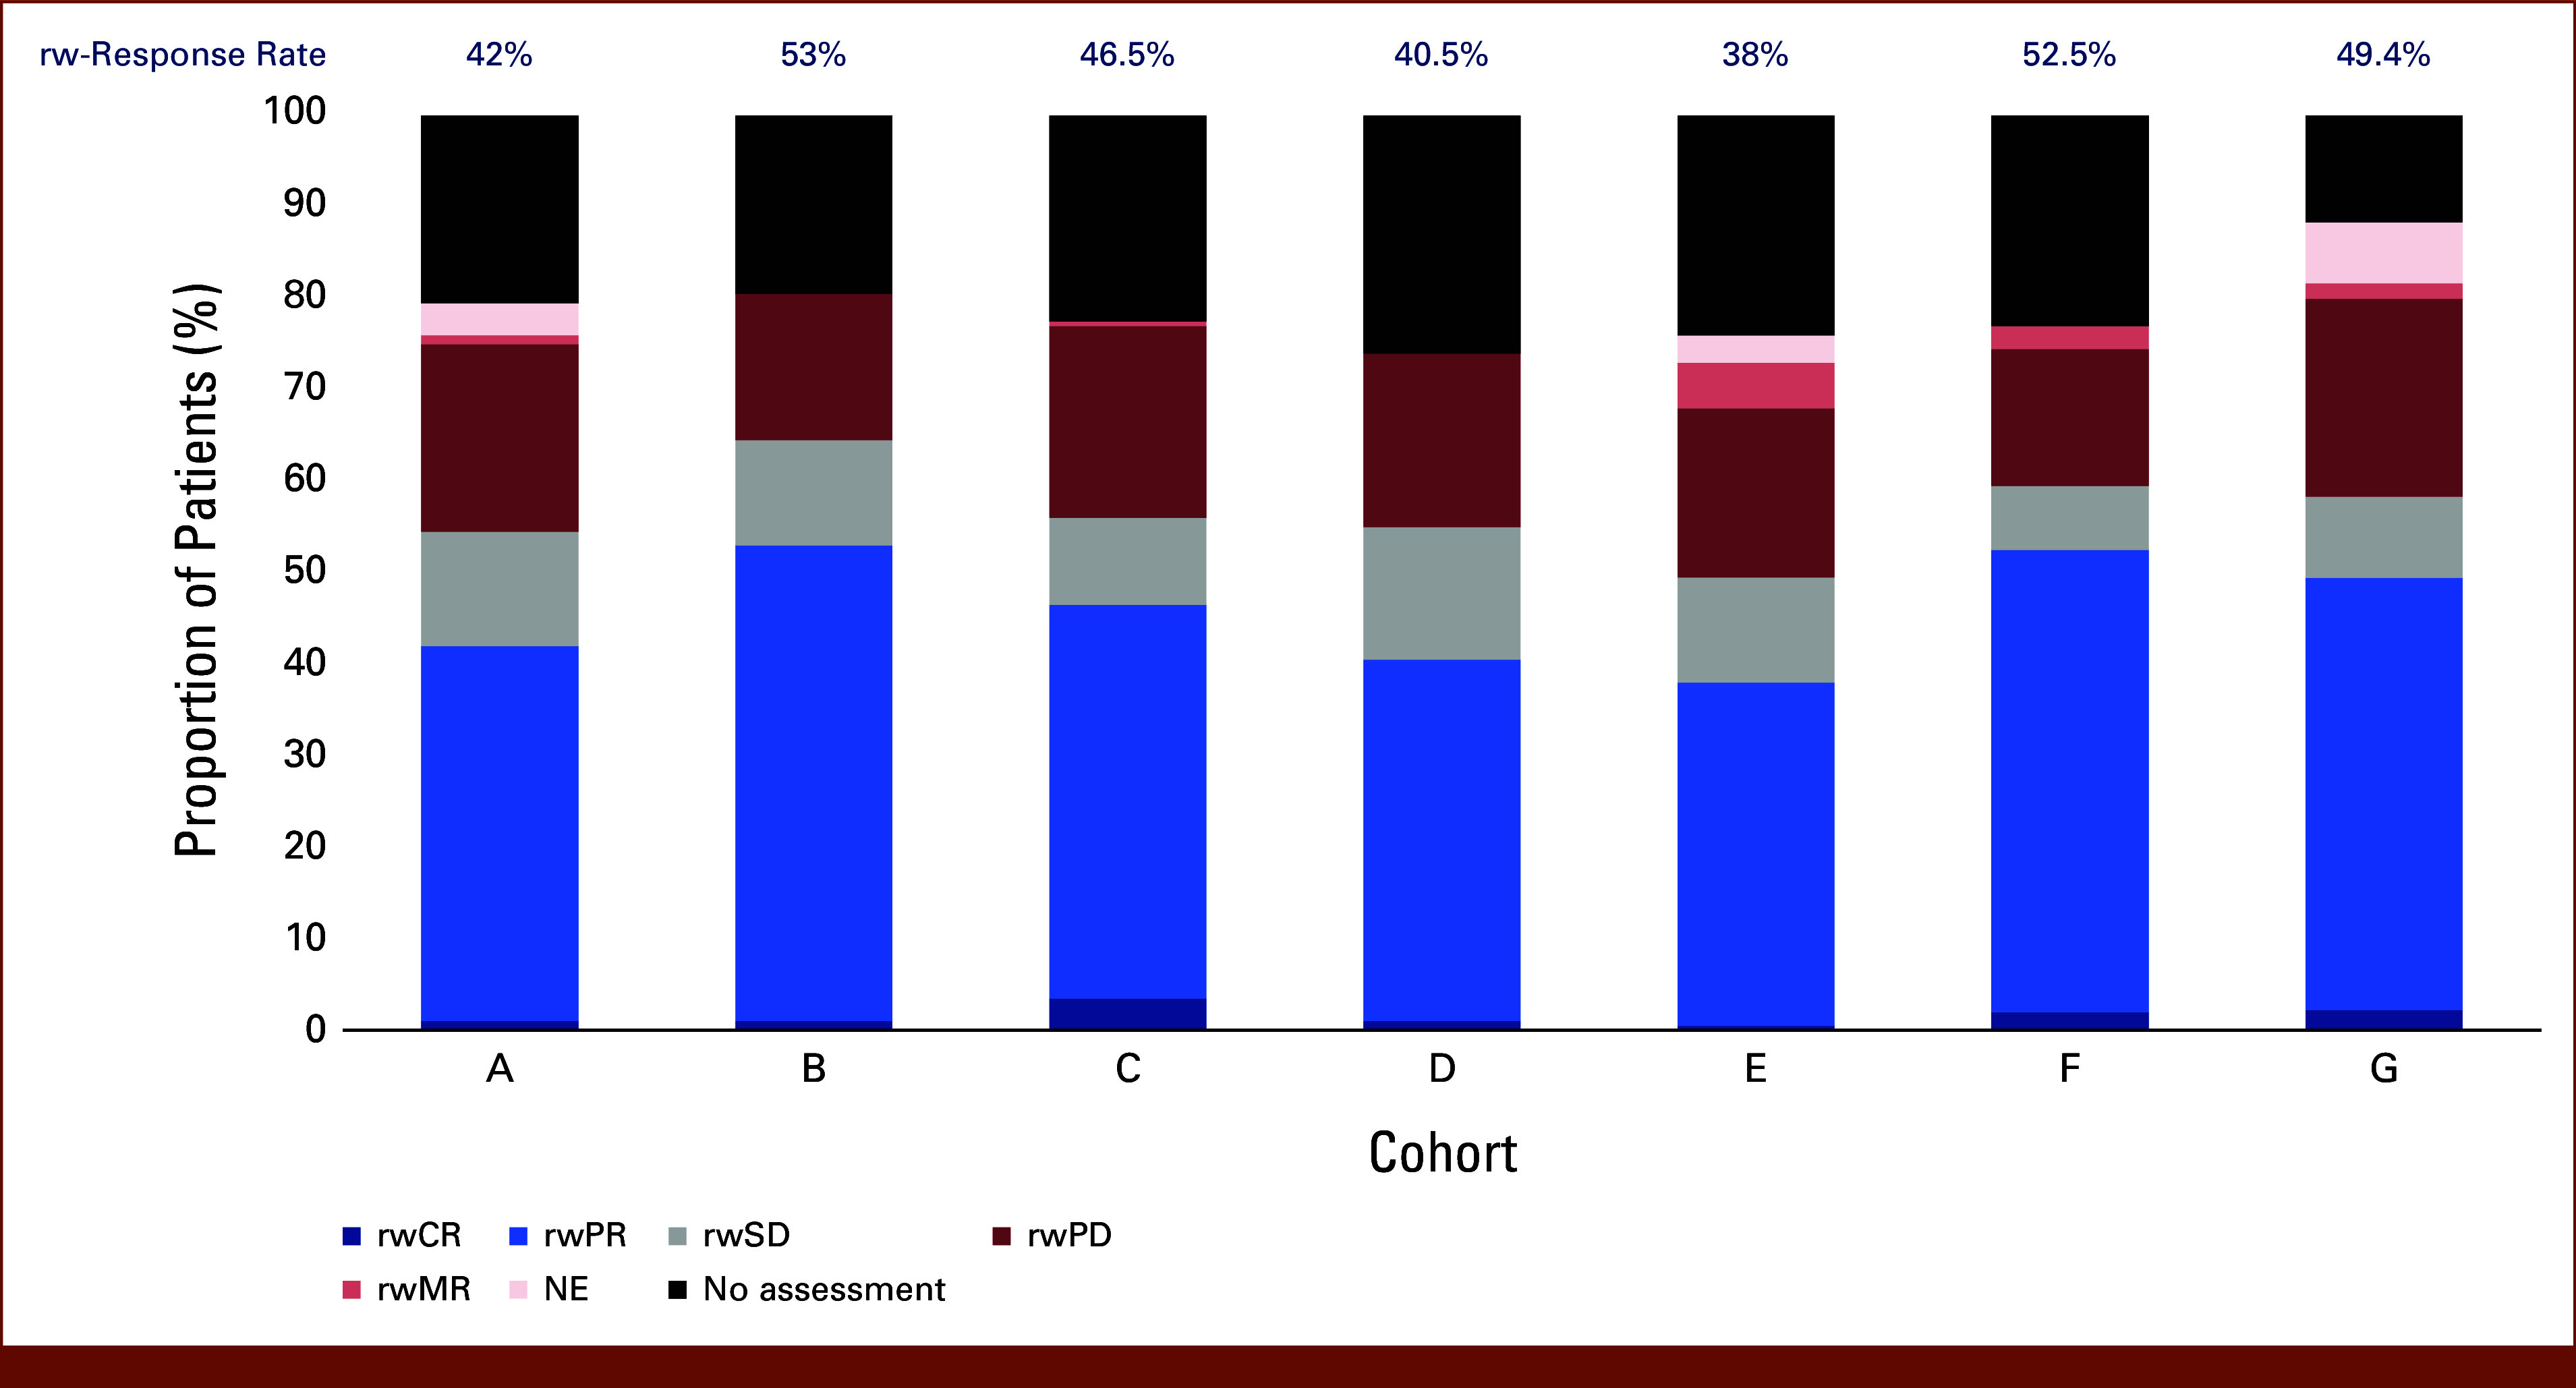
FIG 4.

rw-best overall response and response rate across cohorts. The proportion of patients in each cohort with a given rw-best overall response by clinician assessment of response. Response rate (above bars) is derived from patients with rwPR and rwCR, out of total patients. Cohorts A-F, n = 200 patients; cohort G, n = 180 patients. NE, not evaluable; rw, real-world; rw-response, real-world response; rwCR, rw-complete response; rwMR, rw-mixed response; rwPD, rw-progressive disease; rwPR, rw-partial response; rwSD, rw-stable disease.
