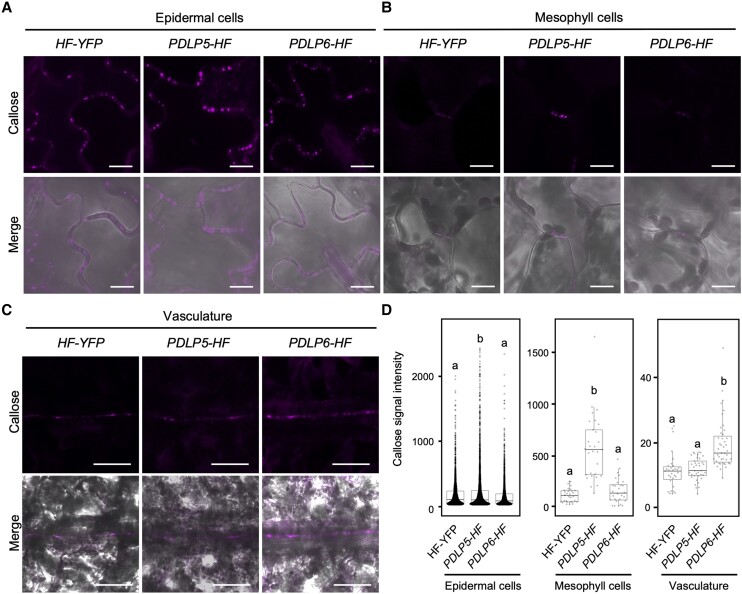
Figure 4.
PDLP5 and PDLP6 regulate PD callose accumulation at different cell interfaces. A) Callose accumulation between leaf epidermal. Puncta signals represent aniline blue–stained callose at plasmodesmata (top panel). Merged images show the signals from callose and bright-field (lower panel). Scale bars = 10 µm. B) Callose accumulation between mesophyll cells. C) Callose accumulation in the leaf vasculature. Scale bars = 50 µm. D) Quantitative data show callose accumulation between epidermal cells, mesophyll cells, and the vasculature. Each dot represents aniline blue–stained callose in the epidermal and mesophyll cells. Mean signal intensity in the vasculature was determined by measuring the vasculature area and total signal intensity. The box plots show the mean with Sd. HF-YFP, n = 2,937 (50 images); PDLP5-HF, n = 4,205 (49 images); and PDLP6-HF, n = 2,499 (41 images) for epidermis. HF-YFP, n = 30 (25 images); PDLP5-HF, n = 29 (20 images); and PDLP6-HF, n = 28 (21 images) for mesophyll cell. HF-YFP, n = 31 (31 images); PDLP5-HF, n = 37 (37 images); and PDLP6-HF, n = 43 (43 images) for the vasculature. Images were captured from 3 leaves, each from a different plant. Different letters on the bar indicate statistically significant differences analyzed with 1-way ANOVA (P < 0.0001).

