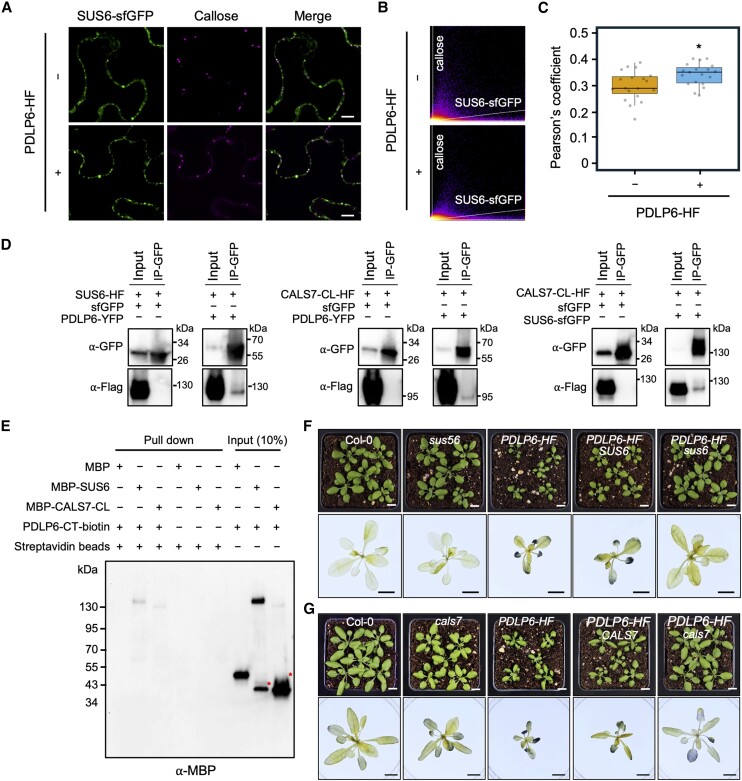
Figure 7.
PDLP6 functions together with SUS6 and CALS7. A) Confocal images show plasmodesmal localization of SUS6-sfGFP with or without overexpressing PDLP6-HF. The fusion proteins were transiently overexpressed in N. benthamiana. Aniline blue–stained callose marked plasmodesmata. Scale bars = 10 µm. B and C) Pearson's coefficient analysis shows that the expression of PDLP6 increases the plasmodesmal localization of SUS6-sfGFP. Each dot represents Pearson's coefficient value calculated for a merged image. Two sets of 19 images were analyzed to quantify the plasmodesmal localization of SUS6-sfGFP, comparing samples with and without overexpression of PDLP6-HF. Images were captured from 3 leaves. The box plots show the mean with Sd (n = 19). An asterisk indicates statistically significant differences analyzed with a Mann–Whitney U test (*P < 0.05). D) Co-IP assay indicates the interaction between PDLP6-SUS6, PDLP6-CALS7, and SUS6-CALS7. Agrobacteria harboring different plasmids were co-infiltrated into N. benthamiana. Samples were collected 2 d after infiltration and subjected to co-IP. A GFP antibody was used to detect the expression of sfGFP fusion protein and the enrichment of sfGFP fusion proteins by GFP-Trap. A Flag antibody was used to detect the expression of HF fusion protein and the interaction between HF and sfGFP fusion proteins. A free sfGFP fusion protein was included as a negative control. Numbers on the side indicate molecular weights in kDa. E) In vitro pull-down assay shows the direct interaction between PDLP6, SUS6, and CALS7. The biotinylated C-terminal tail of PDLP6 (PDLP6-CT-biotin) was incubated with recombinant proteins, MBP, MBP-SUS6, or MBP-CALS7. Magnetic beads coupled with streptavidin were used to pull down PDLP6-CT-biotin and the interacting proteins. A MBP antibody was used to detect the interaction between PDLP6 and MBP fusion proteins. Asterisks indicated nonspecific bands for MBP-SUS6 and MBP-CALS7-CL. Numbers on the side indicate molecular weights in kDa. F) Genetic interactions between PDLP6 and SUS6. G) Genetic interactions between PDLP6 and CALS7. Homozygous lines were isolated from F3 progenies of the genetic crosses of sus56 with PDLP6-HF-2 and cals7 with PDLP6-HF-2. Images in the lower panel show the starch accumulation phenotype. Plants were collected at the end of the night for starch staining using Lugol's iodine solution. Images were taken using the same magnification. Scale bar = 1 cm.

