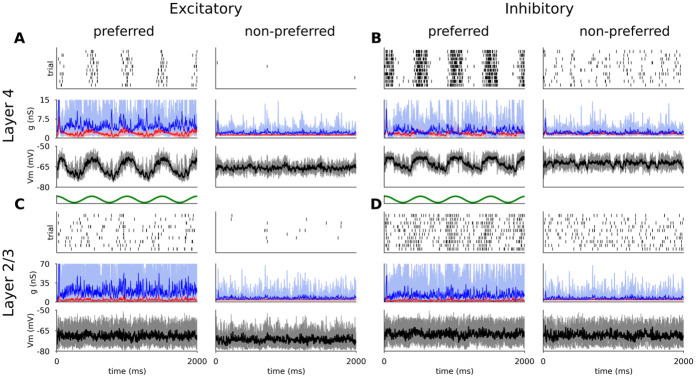
Fig 5. Responses of representative excitatory (A,C) and inhibitory (B,D) neurons from Layer 4 (A,B) and Layer 2/3 (C,D) to 10 trials of DGs of optimal (left) and cross-oriented (right) orientations.
For all neurons, the top panel is a spike raster plot, each line corresponding to a single trial. The middle panel shows the incoming excitatory (red) and inhibitory (blue) synaptic conductances and the bottom panel shows the membrane potential (thin lines: single trials; thick lines: mean). Stimulus onset is at time zero.

