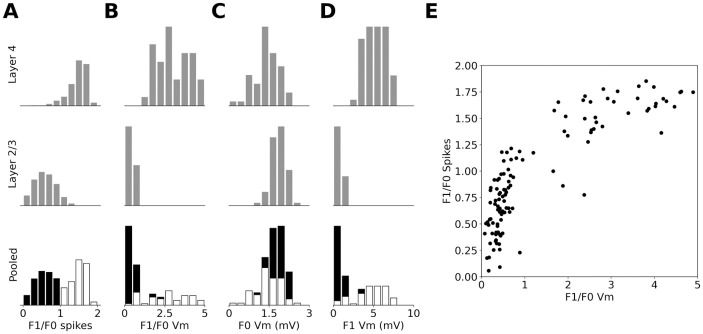
Fig 8. MRs of excitatory cells in the model.
(A) Histogram of MRs calculated from the PSTH over recorded excitatory cells in Layer 4 (first row), Layer 2/3 (second row) and pooled across both layers. (B) as in (A) but MRs calculated from the membrane potential after subtraction of background level. (C) As in A but the histograms are of the absolute value of the F0 component of the membrane potential. (D) As in C but for the F1 component of the membrane potential. (E) The relationship between the MR calculated from PSTH and from membrane potential. In the pooled histogram plots cells classified as Simple are marked white and as Complex are marked black.

