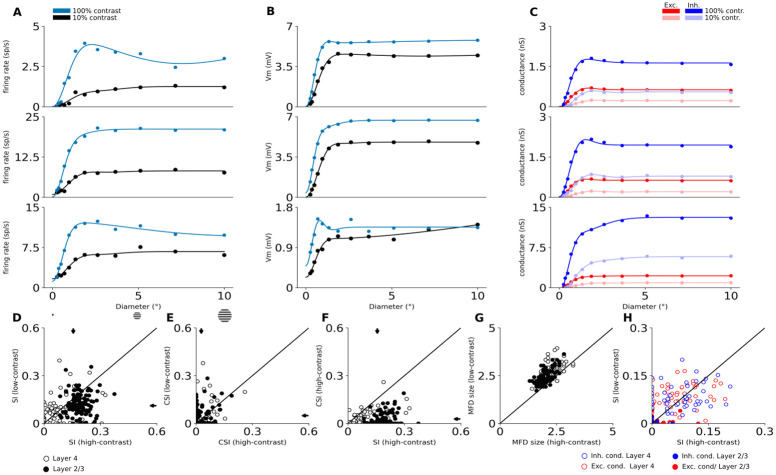
Fig 9. Size tuning in excitatory neurons.
The first three rows show size tuning in three example model neurons. Top row is a typical Layer 4 cell with strong size tuning, second row shows an example of Layer 4 cells that does not exhibit size tuning, and the third row shows a typical Layer 2/3 cell. (A) The size tuning curve of trial-averaged spiking responses. Dots are measured responses, line is fitted size tuning curve. (B) The size tuning curve of trial-averaged mean membrane potential. (C) The size tuning curves of trial-averaged mean excitatory (red) and inhibitory (blue) synaptic conductances. Data shown for low and high contrast conditions: (A-B) low-contrast (10%) condition is black, high-contrast (100%) condition is blue; (C) low-contrast (10%) condition is un-saturated, high-contrast (100%) condition is saturated; (D-H) Scatterplots of size-tuning measures. Arrows mark means after pooling across layers. White (empty in H) dots correspond to individual Layer 4 neurons and black (full in H) dots correspond to Layer 2/3 neurons. (D) The suppression index of spike responses at low vs. high contrast. (E) The counter-suppression index of spike responses at low vs. high contrast. (F) The suppression index vs. the counter-suppression index at high contrast. (G) the maximum facilitation diameter at low vs. high contrast. (H) The suppression index of excitatory (red) and inhibitory (blue) synaptic conductances at low vs. high contrast.

