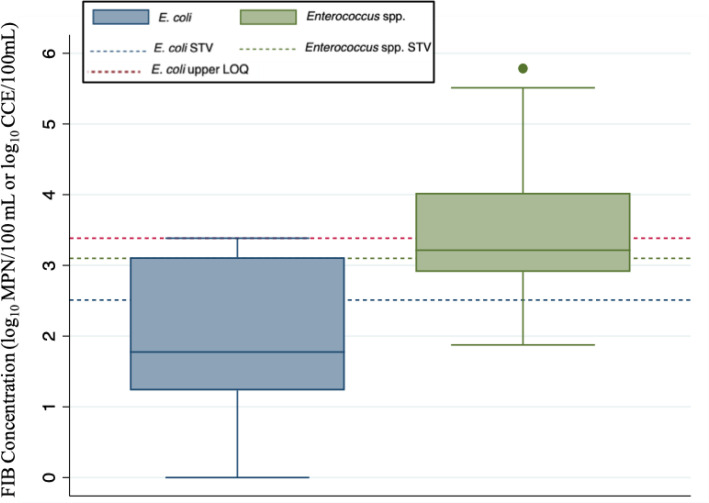
Fig 1.
Box and whisker plots of total FIB distributions in all sampled routine stormwater outfalls combined from Nose Creek in Airdrie, Alberta, Canada (sampled in 2021). The E. coli distribution is represented in blue and the Enterococcus distribution in green. The solid line within each box is representative of the median FIB concentration, and the upper and lower horizontal edges of each box represent the 25th and 75th percentile values of concentration, while whiskers represent ±1.5*interquartile range. Outliers are represented by colored dots outside the range of the upper whisker. Note the dotted lines (blue for E. coli, green for Enterococcus) representing acceptable recreational water quality criteria for E. coli (320 MPN/100 mL) and Enterococcus (1,280 CCE/100 mL) (59), as well as the red dotted line representing the upper limit of quantification of the Colilert assay (2,419.60 MPN/100 mL).

