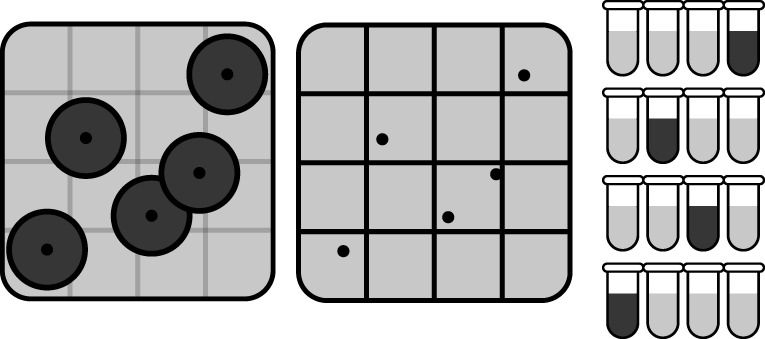
Fig 1.
Visual equivalence between plate and tube-based assays. The left panel is a cartoon of a typical plate containing colonies, where the growing colonies are shown as dark disks. In the middle panel, the plate is divided into N (here 16) approximately colony-sized regions. If a region contains one or more colony centers (black dots), this region can be mapped to a positive (dark) tube as shown in the right panel. Similarly, regions containing no colony centers are mapped to negative (light) tubes. This demonstrates that plating is equivalent to a massive parallel version of a tube-based assay with Furthermore, it demonstrates that the MPN method can be used for plate data.

