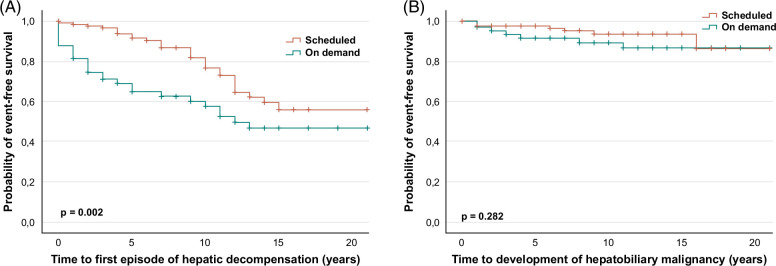
FIGURE 3.
Time to development of the first episode of hepatic decompensation and time to development of hepatobiliary malignancy. Kaplan-Meier analysis reveals a significantly longer time to the first episode of hepatic decompensation in the scheduled cohort (red curve) compared to the on-demand cohort (P = 0.002) (A). No significant association could be observed when analyzing the time to development of hepatobiliary malignancies between both cohorts (P = 0.282) (B); (*P < 0.05; **P < 0.01; ***P < 0.001).

