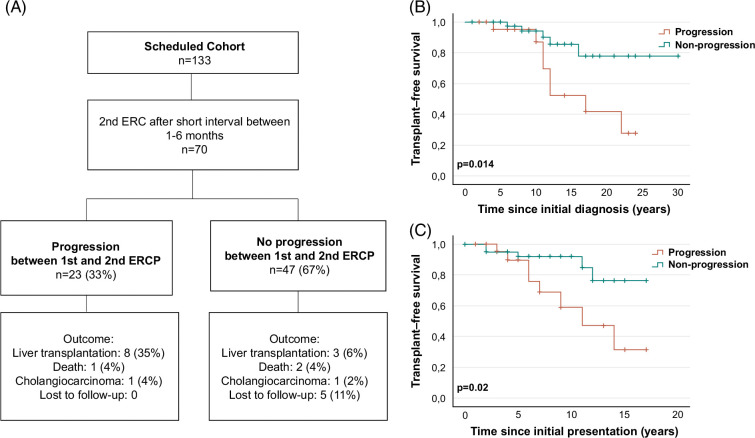
FIGURE 4.
Outcome analysis and transplant-free survival in the progression versus nonprogression cohort. (A) Flowchart with an overview of outcome analysis results in the progression versus nonprogression cohort. Kaplan-Meier analysis of transplant-free survival (TFS) in the progression (orange curve) versus nonprogression (green curve) cohort revealed a poorer outcome for the progression cohort since initial diagnosis (median TFS: 17 y vs. undefined; P = 0.014) (B) and since initial presentation (median TFS: 11 y vs. undefined; P = 0.02) (C).

