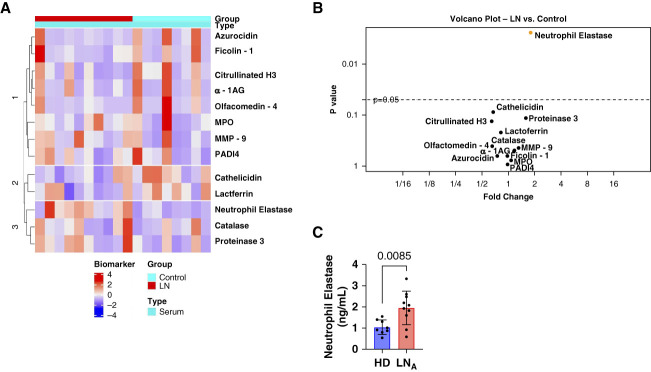
Figure 5.
Serum concentration of granule proteins in LN. (A) Serum from the same ten patients with LN and eight HDs was examined for expression of 11 granule proteins and two NET-associated proteins by custom antibody-based array (RayBiotech). The scaled and centered data were plotted as a heatmap in which the different colors represent biomarker expression levels. The proteins and samples were then subjected to hierarchical clustering based on Euclidean distance. (B) Volcano plot where each point represents one biomarker. The protein values were summarized by its mean and SD or median with minimum and maximum responses across the groups. The fold change between groups was calculated as the ratio of the mean or median. If a protein met or did not meet normality criteria across the group, the significance of expression difference was evaluated by the paired t test or signed-rank test, respectively. Proteins with FDR <0.05 were considered as differentially expressed. (C) ELISA validation of serum neutrophil elastase (n=10 active LN, n=6 control). LNA represents active LN. The data were analyzed using a Mann–Whitney test. Data were represented as mean±SD.

