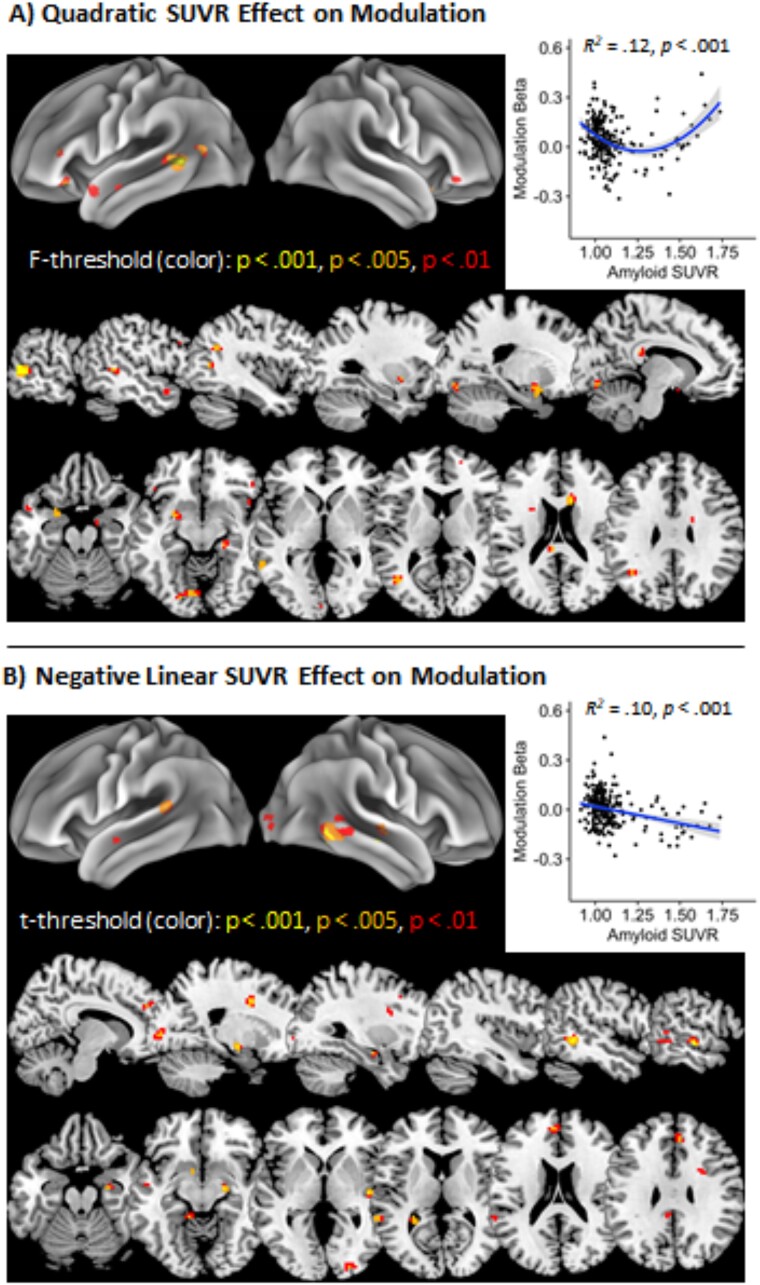
Fig. 4.
Nonlinear and linear associations between BOLD modulation and amyloid SUVR. (A) Quadratic effect of amyloid SUVR on demand-based modulation (high—Low demand) at multiple F-value thresholds in left sagittal and axial slices (bottom) and with average modulation beta weights across the full P < 0.005 map plotted (top-right). (B) Negative linear effect of amyloid SUVR on demand-based modulation (high—Low demand) at multiple t-value thresholds in right sagittal and axial slices (bottom) and with average modulation beta weights across the full P < 0.005 map plotted (top-right). Scatter plots include 95% confidence intervals for each trend in shaded gray.

