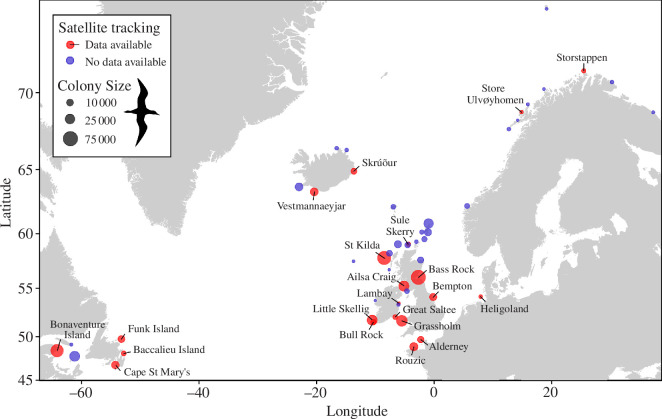
Figure 1.
All 54 Northern Gannet Morus bassanus colonies with circles proportional to colony size. Red circles indicate 21 colonies for which satellite tracking data were used in this study. No data available for colonies indicated by blue circles. Map adapted from tiles by Stamen Design, under Creative Commons (CC BY 3.0) using data by OpenStreetMap, under the Open Database Licence.

