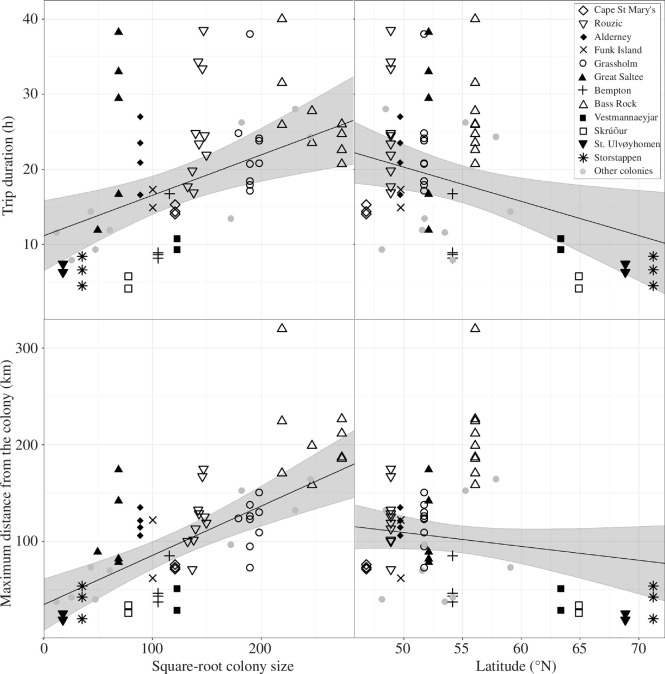
Figure 3.
Annual mean foraging trip duration and maximum distance from the colony for 21 Northern Gannet Morus bassanus colonies in relation to colony size and latitude. Black symbols show the 13 colonies for which multiple years of tracking data were available (2−11 years). Grey circles indicate the eight colonies where only 1 year of data was available. Black lines show the prediction from a linear mixed model with colony fitted as a random intercept ±95% confidence intervals (grey ribbon) using the mean value of latitude to predict the effect of square-root colony size and vice versa.

