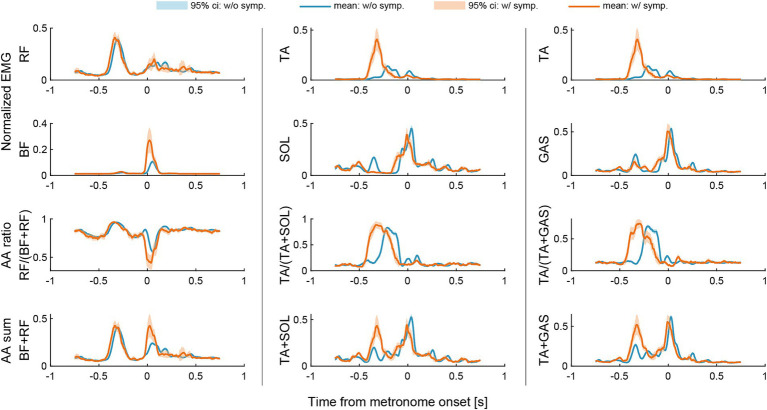
Figure 4.
Changes in agonist–antagonist (AA) ratios and AA sums around the metronome onset of the first beat. The AA ratio contributes to the equilibrium position of the joint angle, and the AA sum indicates the stiffness of the joint. Data were plotted for a period of 750 milliseconds (msec) before and after the onset of each metronome sound. Light blue lines and areas represent the ensemble average and the 95% confidence interval for instances without symptoms (w/o symp.), while orange lines and areas correspond to instances with symptoms (w/symp.).

