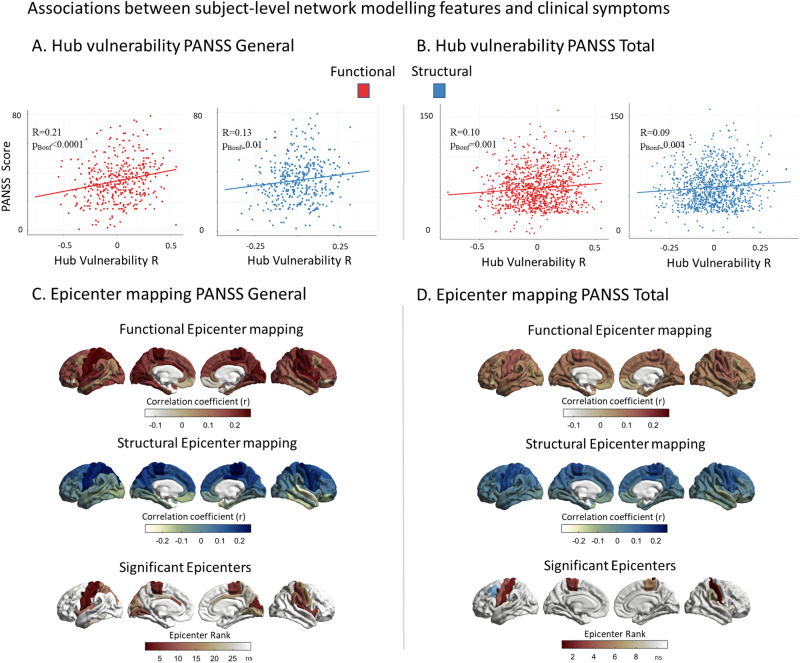
Fig. 5. Associations between subject-level network modeling and individual symptoms.
A Correlation between subject-level functional (red) and structural (blue) hub vulnerability of cortical alterations and PANSS general scores (rfunc = 0.21, pBonf < 0.0001, rstruc = 0.13, pBonf = 0.01). B Correlation between subject-level functional (red) and structural (blue) hub vulnerability of cortical alterations and PANSS total scores (rfunc = 0.10, pBonf = 0.001, rstruc = 0.09, pBonf = 0.004). C Correlations between subject-level functional (red) and structural (blue) epicenter likelihood and PANSS general scores. Significant associations were only found for functional epicenters spanning from sensory-motor areas to cingulate gyrus and insula (all r > .18, pBonf < 0.05). D Correlations between subject-level functional (red) and structural (blue) epicenter likelihood and PANSS total scores. Significant associations were found for functional epicenters in the bilateral somatosensory and motor cortices extending to supramarginal gyrus (in blue) as the only structural epicenter ((all r > 0.11, pBonf < 0.05).

