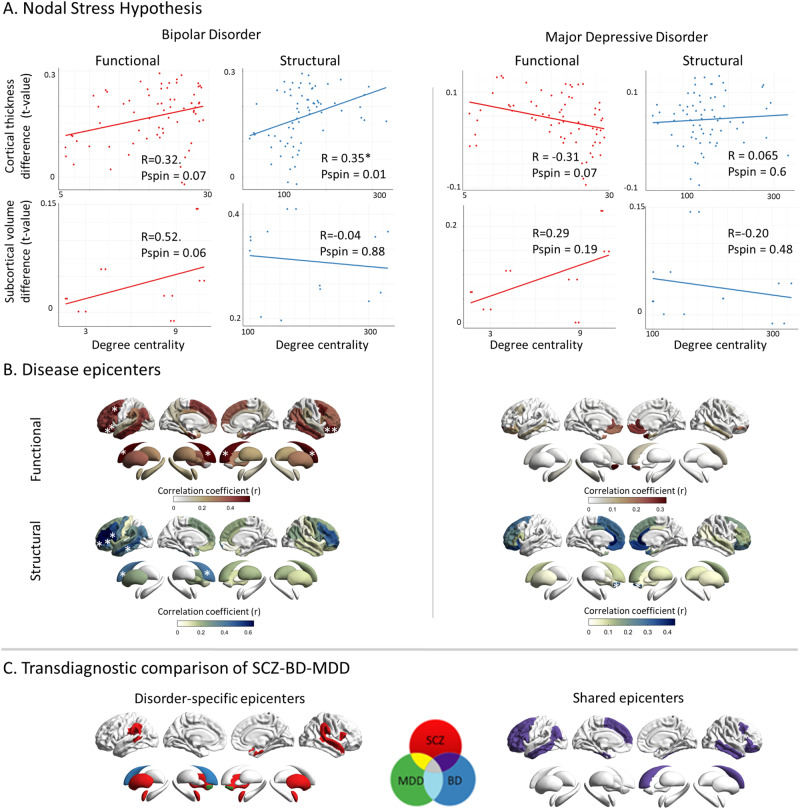
Fig. 6. Cross-disorder comparison of network modeling.
A Correlation of disorder-related gray matter alterations to node-level functional (left) and structural (right) maps of degree centrality in BD and MDD. In BD, cortical regions with high structural centrality are significantly more likely to display higher morphological alterations; this trend is also observed for functional centrality. No such relationship is observed in MDD. B Correlation coefficient maps depicting strength of association between the normative region-based functional (top) and structural (bottom) connectivity and the BD- (left) and MDD-specific (right) morphological alteration maps. Asterisks denote the significant epicenters. Functional BD epicenters: pars orbitalis of inferior frontal gyrus (L), lateral orbitofrontal cortex (L), caudal middle frontal gyrus (L), inferior and middle temporal gyrus (L) cortically and the caudate nucleus (L) in the subcortex (func: bilateral, struc: left). Structural BD epicenters: pars opercularis (L) and pars triangularis (L) of inferior frontal gyrus, rostral middle frontal gyrus (L), middle temporal gyrus (L) cortically and the caudate nucleus (L), subcortically. In MDD, no functional epicenters were detected. Structural MDD epicenters: nucleus accumbens (R). C Transdiagnostic comparison of epicenters between SCZ, BD, and MDD. Disorder- specific epicenters which are only significant in one disorder are displayed on the left side. Shared epicenters between at least two disorders are shown on the right side. Please note, that shared epicenters were only found for SCZ and BD but not MDD: Bipolar disorder; MDD: Major depressive disorder; SCZ: Schizophrenia.

