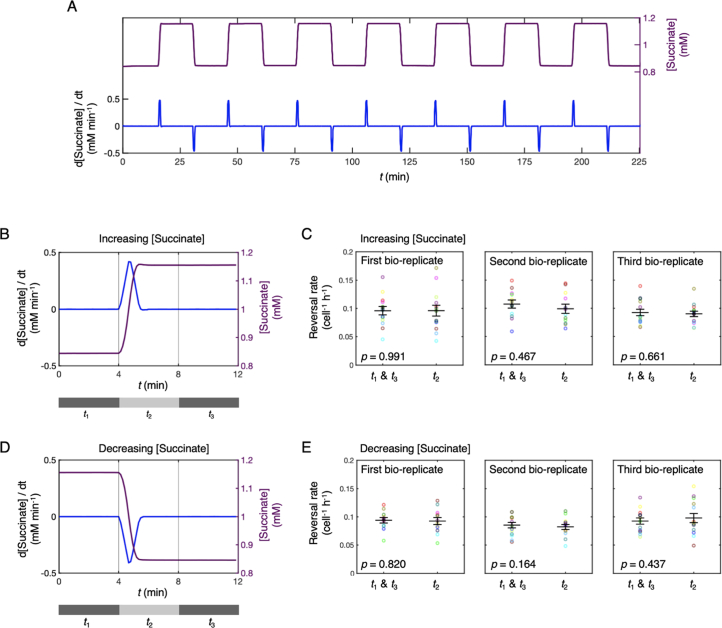
Extended Data Fig. 6. Steep, rapid temporal chemoattractant gradients do not cause surface-attached P. aeruginosa cells to change their reversal rate.
(a) Twitching is characteristically jerky and cells could have evolved to detect the large but ephemeral temporal changes in chemoattractant concentration caused by these intermittent displacements. To test this hypothesis, we used a microfluidic setup that exposed surface-attached cells to rapid temporal changes in succinate concentration (see Methods). We used dye to quantify temporal changes in succinate concentration (purple line) and the temporal succinate gradients (blue line) that cells experienced in these experiments. In this experiment, cells are repeatedly exposed to both increases and decreases in succinate concentration. (b) To analyse cells’ response to these different stimuli, we first split reversal data around each increase in succinate concentration into three time-bins t1, t2, and t3 corresponding to the 4 min intervals before, during and after the temporal gradient. (c) Reversal rates were pooled across time windows t1 and t3, corresponding to time periods without any succinate concentration gradients, and compared to the reversal rates during the temporal increases in succinate concentration, time-bin t2. The mean reversal rate measured during the temporal increase in succinate concentration (large black ‘-’ marker) was statistically indistinguishable from that when the succinate concentration was constant (a two-tailed, paired t-test of the null hypothesis of no difference in reversal rates yielded p = 0.991, 0.467 and 0.661 for three independent bio-replicates). Mean reversal rates were averaged across six subsequent increases in succinate concentration (see (A)) each imaged across two independent fields of view (the 12 circular markers are colour-coded to show pairs of data recorded in each of the 12 fields of view, see Methods). (d, e) Similar results were obtained when comparing reversal rates between the presence (t2) and absence (t1 and t3) of temporal decreases in succinate concentration (a two-tailed, paired t-test of the null hypothesis of no difference in reversal rates yielded p = 0.820, 0.164 and 0.437 for three independent bio-replicates). Error bars show mean reversal rates plus and minus standard error. Source data provided as a Source Data file.

