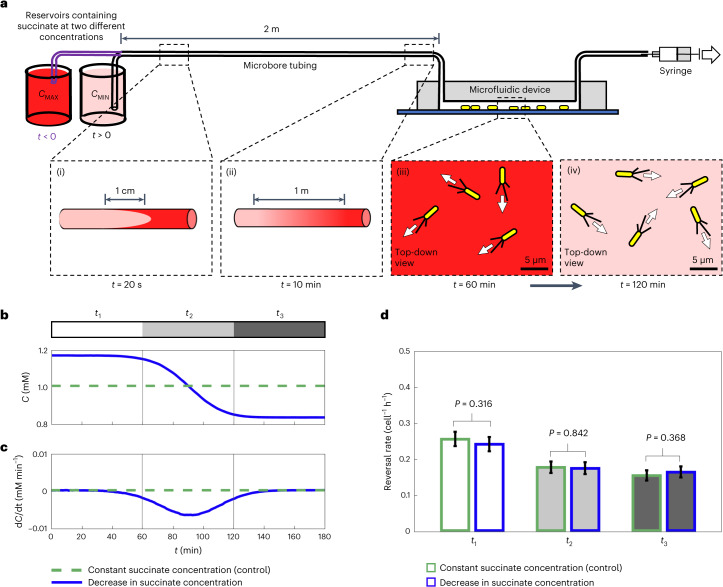
Fig. 2. Temporal changes in concentration do not induce a chemotactic response in surface-attached P. aeruginosa.
a, We used Taylor–Aris dispersion to generate concentration gradients along a 2 m long tube, which then flowed past surface-attached cells in microfluidic devices. We filled the system with media containing succinate (CMAX = 1.16 mM). At t = 0, media containing a lower succinate concentration (CMIN = 0.84 mM) was pulled through the system. As fluid moves fastest along a tube’s centreline, a plug of lower concentration fluid forms (panel i) but is rapidly mixed across the tube width via molecular diffusion (panel ii). The fluid interface forms a longitudinal gradient with an ~1.6 m length scale such that surface-attached cells within the device experience smooth temporal decreases in concentration (panel iii to panel iv). b,c, Using dye, we quantify succinate concentration (b) and temporal concentration gradient over time (c) (blue lines; dashed green lines show a control with 1 mM succinate throughout). Cells experience approximately the same mean temporal concentration gradient that cells experience in dual-inlet chemotaxis experiments (Extended Data Fig. 1 and ref. 33), but with ~16,000-fold smaller spatial gradients. d, In the 1 h period before the succinate gradient entered the device (interval t1), cell reversal rates were statistically indistinguishable between experiment (white bar, blue outline) and control (white bar, green outline; one-sided exact Poisson test (Methods) yielded P = 0.316). Similarly, reversal rates in the presence of a temporal succinate gradient (interval t2; light grey bar, blue outline) and in the 1 h period after the gradient had cleared the microfluidic device (interval t3; dark grey bar, blue outline) were statistically indistinguishable from the reversal rates in the control (P = 0.842 and P = 0.368). The number of reversals observed was nr = 1,496 and 1,391 across nt = 468,596 and 439,632 trajectory points in the control and experimental conditions, respectively. Error bars show 95% confidence intervals about the mean reversal rates assuming that reversals follow a Poisson distribution (Methods). Data shown here are representative of two bio-replicates (Extended Data Fig. 5). Source data provided as a Source data file.

